Open Access
Fig. 13
Download original image
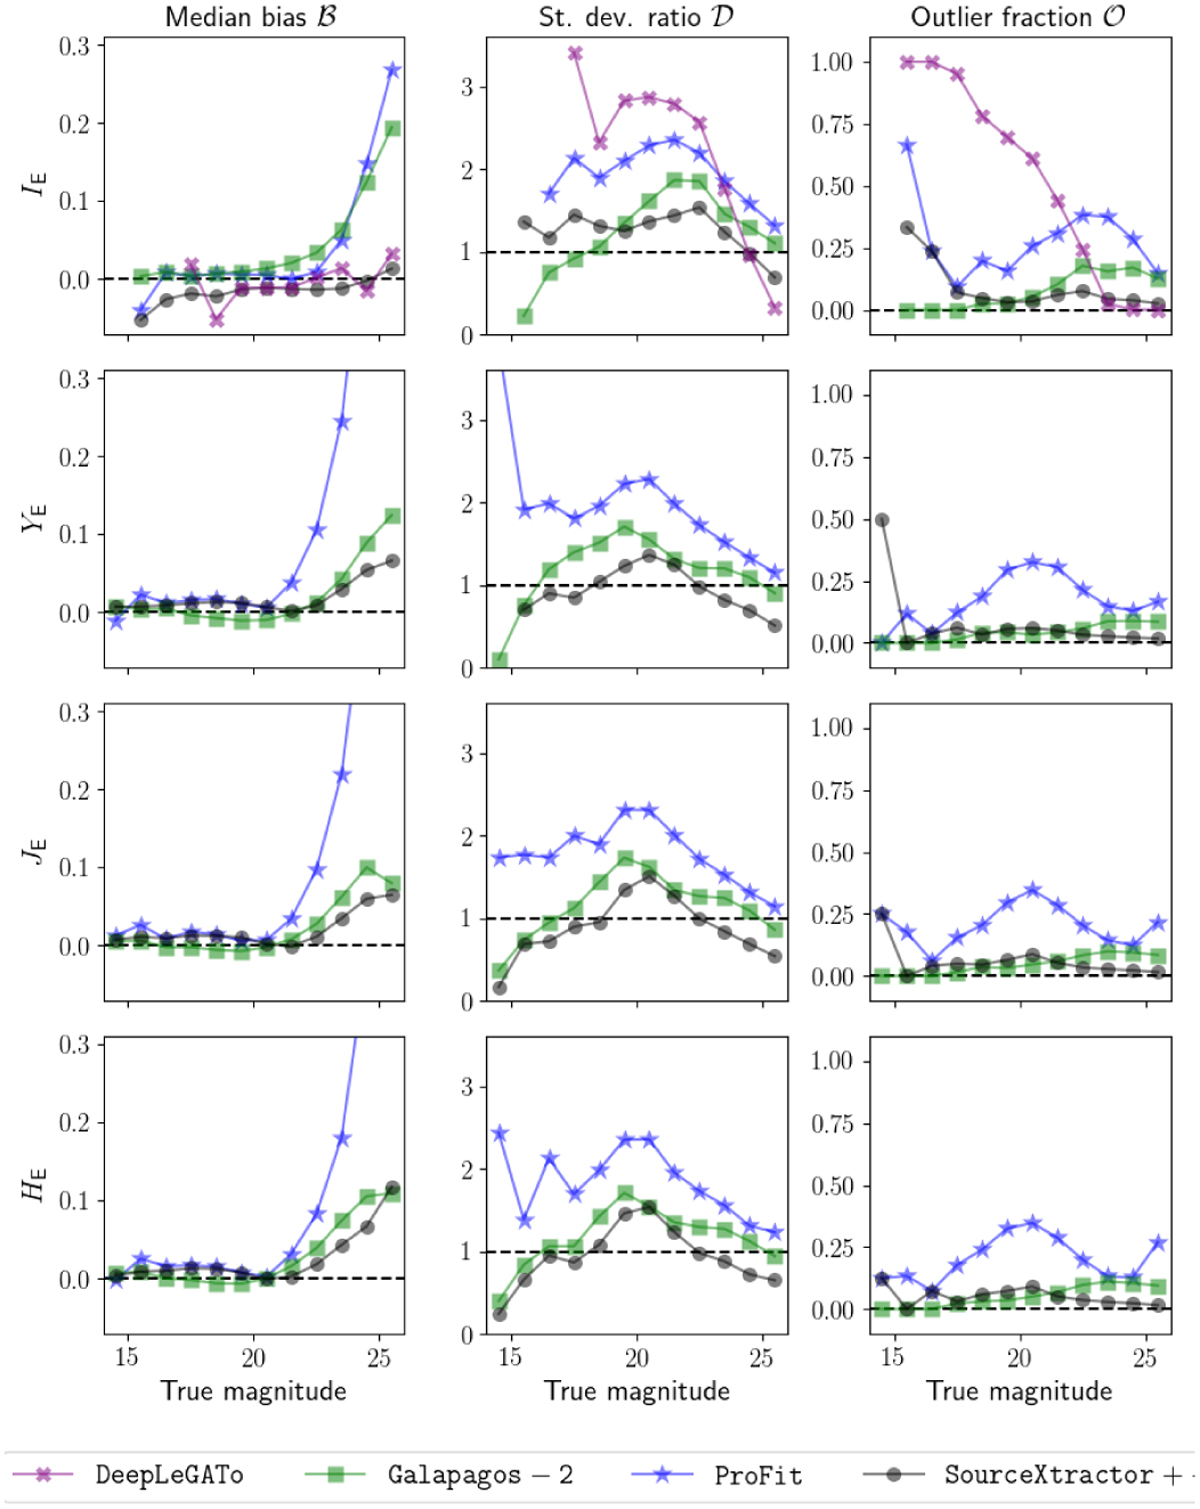
Multi-band summary plots for IE and the NIR bands. Left to right: median bias ℬ; dispersion (standard deviation) 𝒟; and fraction of outliers 𝒪. Top to bottom: IE, YE, JE, and HE. Each line and colour correspond to a different code as indicated in the legends; note the different y-axis scales.
Current usage metrics show cumulative count of Article Views (full-text article views including HTML views, PDF and ePub downloads, according to the available data) and Abstracts Views on Vision4Press platform.
Data correspond to usage on the plateform after 2015. The current usage metrics is available 48-96 hours after online publication and is updated daily on week days.
Initial download of the metrics may take a while.