Fig. 6
Download original image
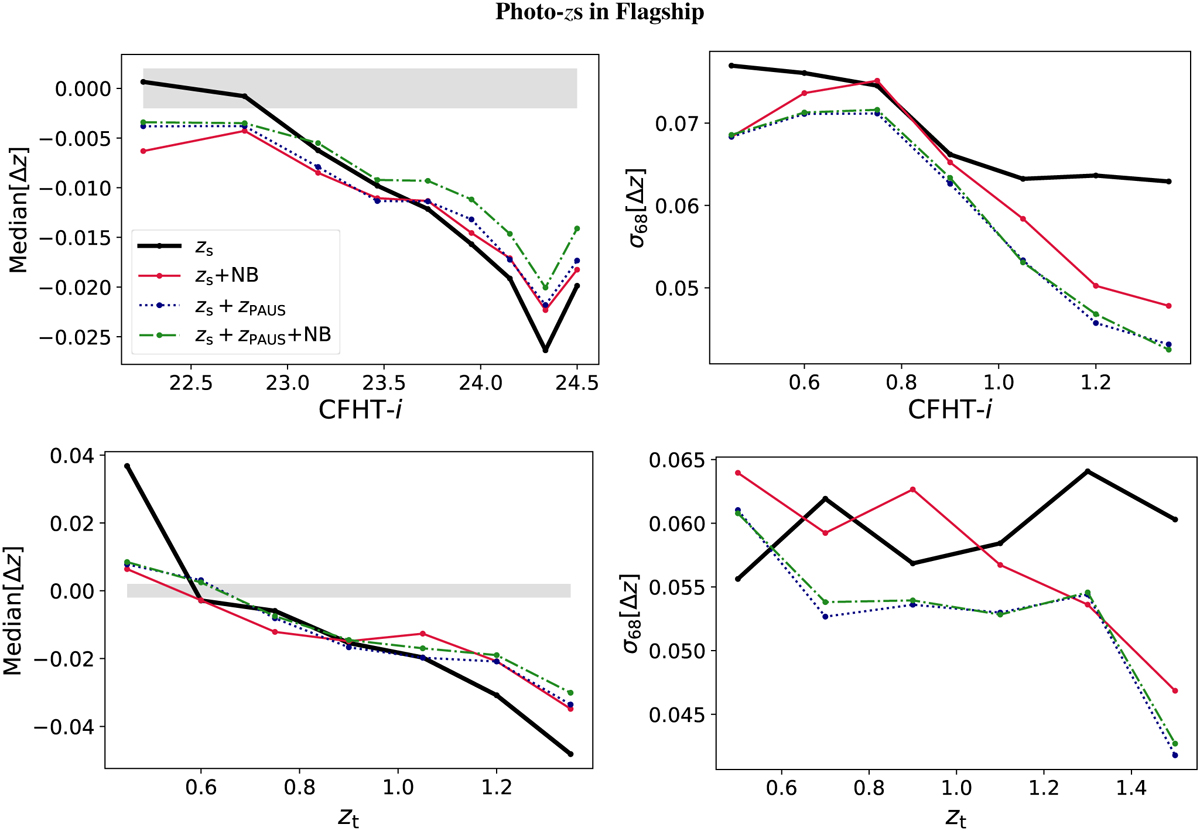
Top: photo-z bias (left) and precision (right) in equally populated magnitude bins. Bottom: photo-z bias (left) and dispersion (right) in equally spaced spectroscopic redshift bins. The shaded grey areas indicate ∆z > 0.002, corresponding to the Euclid requirement for the photo-z bias. All plots are for 30 000 Flagship test galaxies with magnitudes iAB < 24.5 for the methods presented in Sect. 3.2. The training sample contains around 15 000 spectroscopic galaxies, extended to 30 000 with PAUS-like galaxies without spectroscopy, all of them to iAB < 23.
Current usage metrics show cumulative count of Article Views (full-text article views including HTML views, PDF and ePub downloads, according to the available data) and Abstracts Views on Vision4Press platform.
Data correspond to usage on the plateform after 2015. The current usage metrics is available 48-96 hours after online publication and is updated daily on week days.
Initial download of the metrics may take a while.