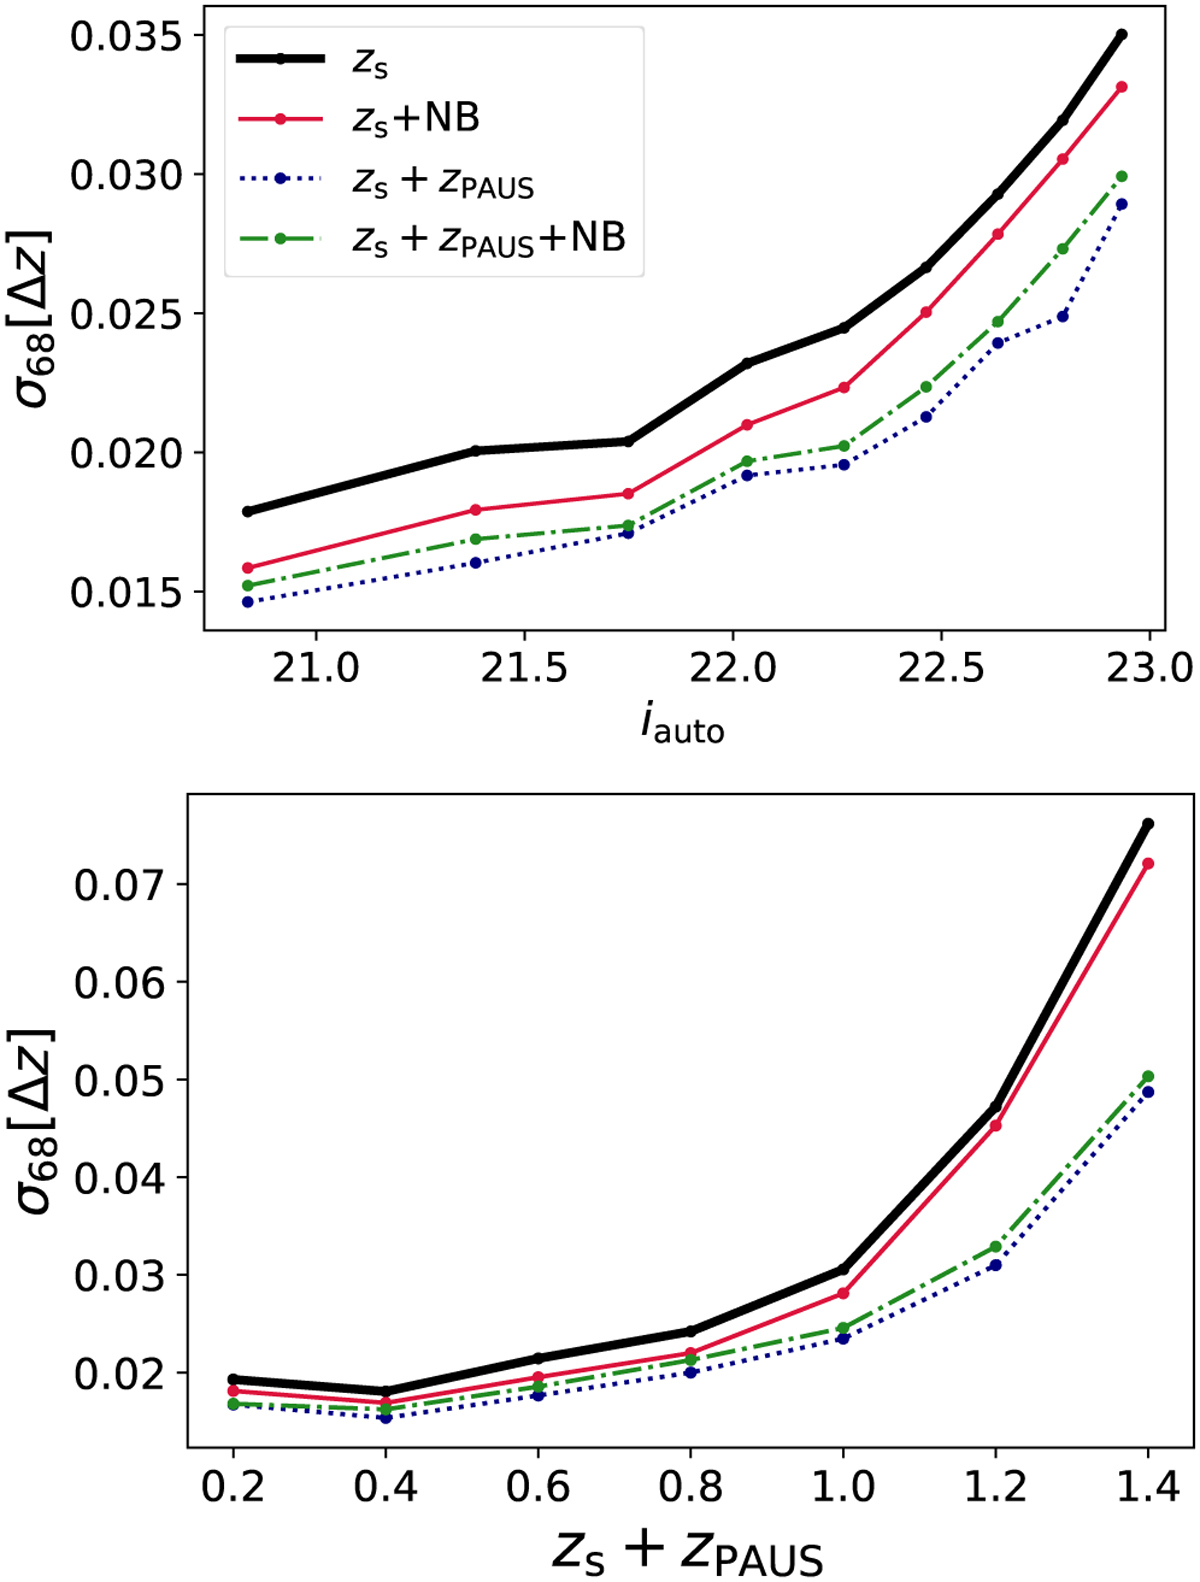
Fig. 3
Download original image
Photo-z dispersion in equally populated magnitude differential bins to iAB < 23 (top) and equally spaced redshift bins to z < 1.5 (bottom). Each line corresponds to a different training procedure (see Sect. 3.2). While the black line corresponds to a baseline training, the other coloured lines include MTL (red and green lines) and data augmentation with photo-zs from the PAUS+COSMOS catalogue as ground-truth redshifts (blue and green lines).
Current usage metrics show cumulative count of Article Views (full-text article views including HTML views, PDF and ePub downloads, according to the available data) and Abstracts Views on Vision4Press platform.
Data correspond to usage on the plateform after 2015. The current usage metrics is available 48-96 hours after online publication and is updated daily on week days.
Initial download of the metrics may take a while.