Fig. 2
Download original image
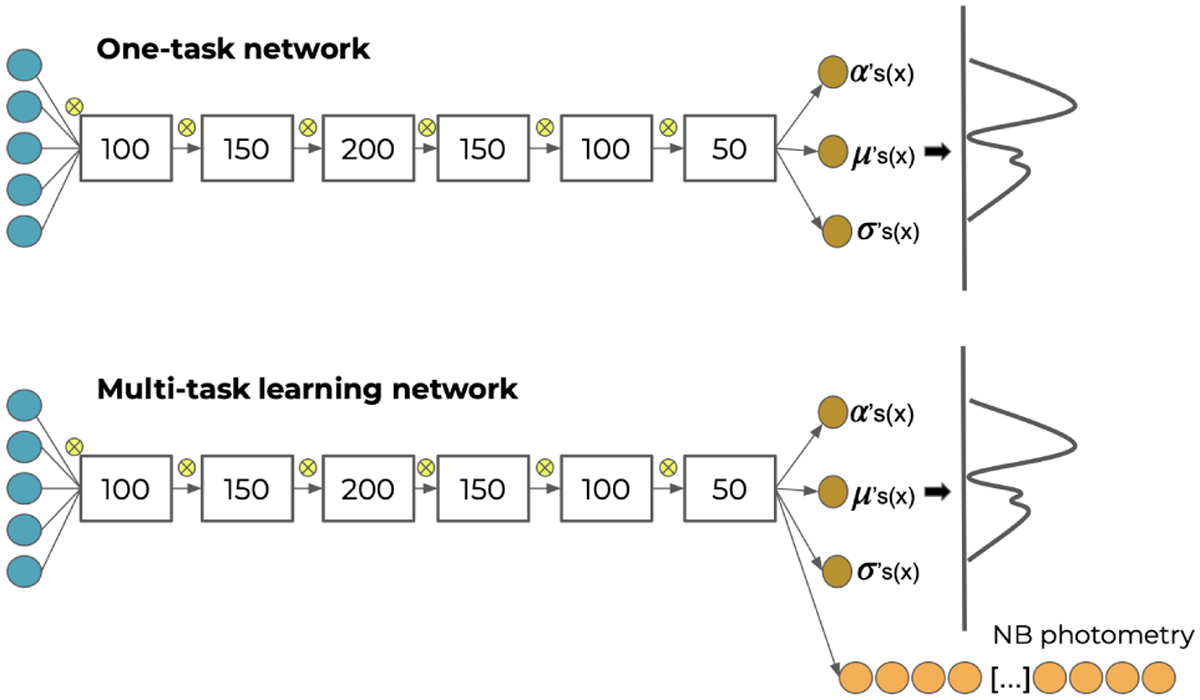
Top: baseline network architecture. The input contains five colours that propagate through six fully connected layers. Each layer is followed by a dropout layer, which is represented by a yellow-crossed circle. Bottom: MTL network. This builds on the baseline network and adds an extra output layer for the additional task of predicting the narrow-band photometry.
Current usage metrics show cumulative count of Article Views (full-text article views including HTML views, PDF and ePub downloads, according to the available data) and Abstracts Views on Vision4Press platform.
Data correspond to usage on the plateform after 2015. The current usage metrics is available 48-96 hours after online publication and is updated daily on week days.
Initial download of the metrics may take a while.