Fig. 2.
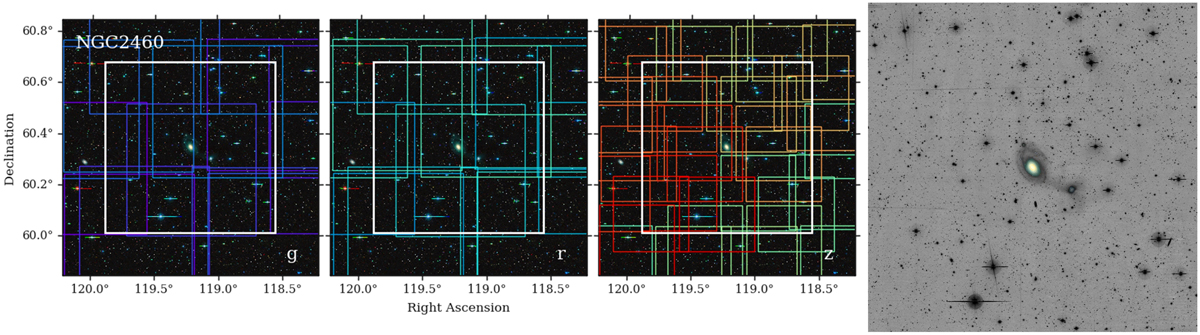
Download original image
Example of the deep mosaics we construct from the individual DESI Legacy Imaging Surveys exposures overlapping our target galaxies. From left to right, panels show g, r, and z bands. The white rectangle shows the region we process with our custom pipeline around a given target (here NGC 2460), coloured rectangles show each individual CCD frame in the stack. The overlapping tiling pattern is visible. Since this galaxy is in the northern footprint of the DESI Legacy Imaging Surveys, the g and r bands are from BASS, where the CCD pixel scale is larger than in the z band, which is from MzLS. The right-most panel shows the final mosaic.
Current usage metrics show cumulative count of Article Views (full-text article views including HTML views, PDF and ePub downloads, according to the available data) and Abstracts Views on Vision4Press platform.
Data correspond to usage on the plateform after 2015. The current usage metrics is available 48-96 hours after online publication and is updated daily on week days.
Initial download of the metrics may take a while.