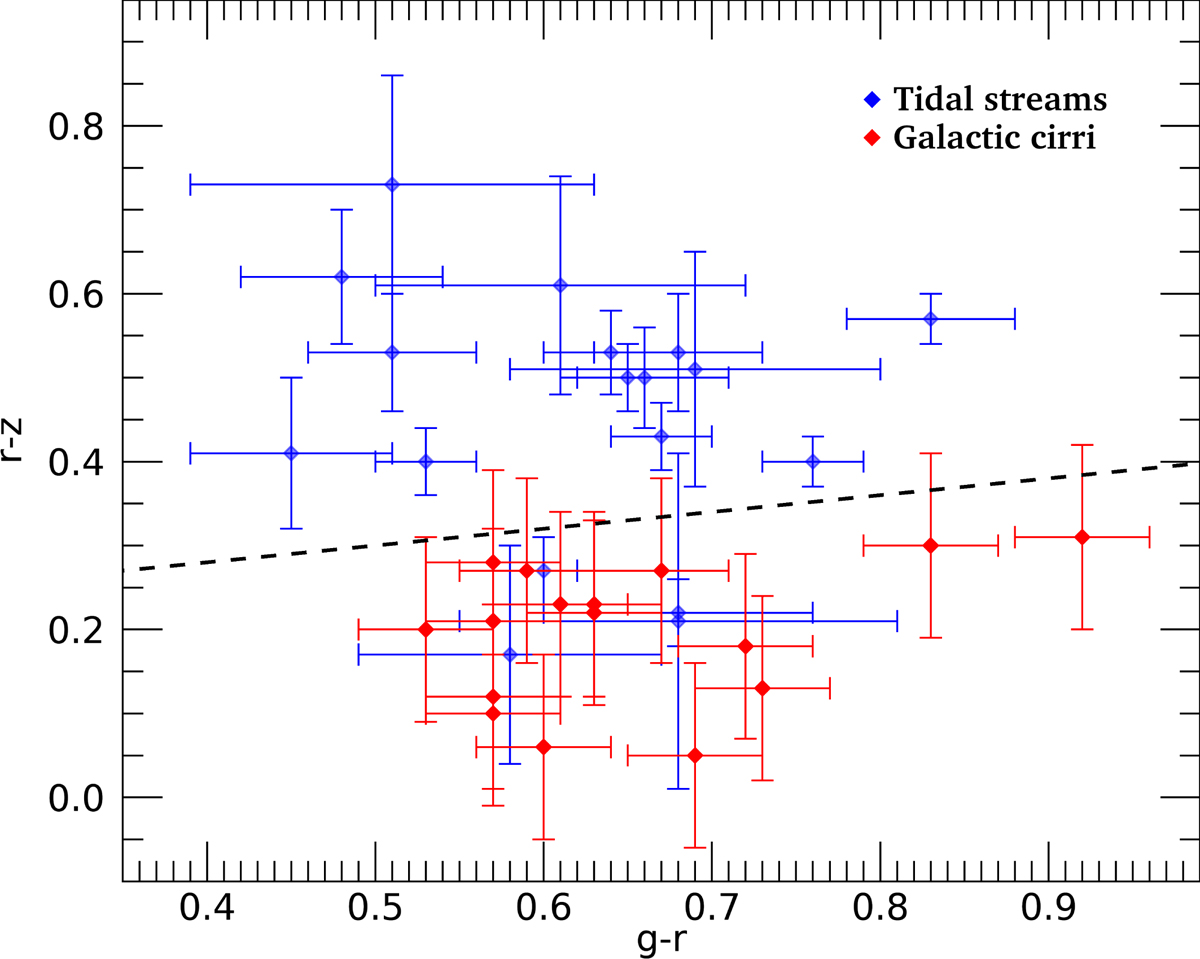
Fig. 11.
Download original image
g − r vs. r − z colours for the tidal streams presented in Table 2 (we exclude tidal features with colour errors > 0.25 mag for clarity) and the Galactic cirri regions characterised by Román et al. (2020). The black dashed line, (r − z) = 0.20 × (g − r)+0.20, limits the regions where the colours are compatible/incompatible (below/above of the line) with Galactic dust.
Current usage metrics show cumulative count of Article Views (full-text article views including HTML views, PDF and ePub downloads, according to the available data) and Abstracts Views on Vision4Press platform.
Data correspond to usage on the plateform after 2015. The current usage metrics is available 48-96 hours after online publication and is updated daily on week days.
Initial download of the metrics may take a while.