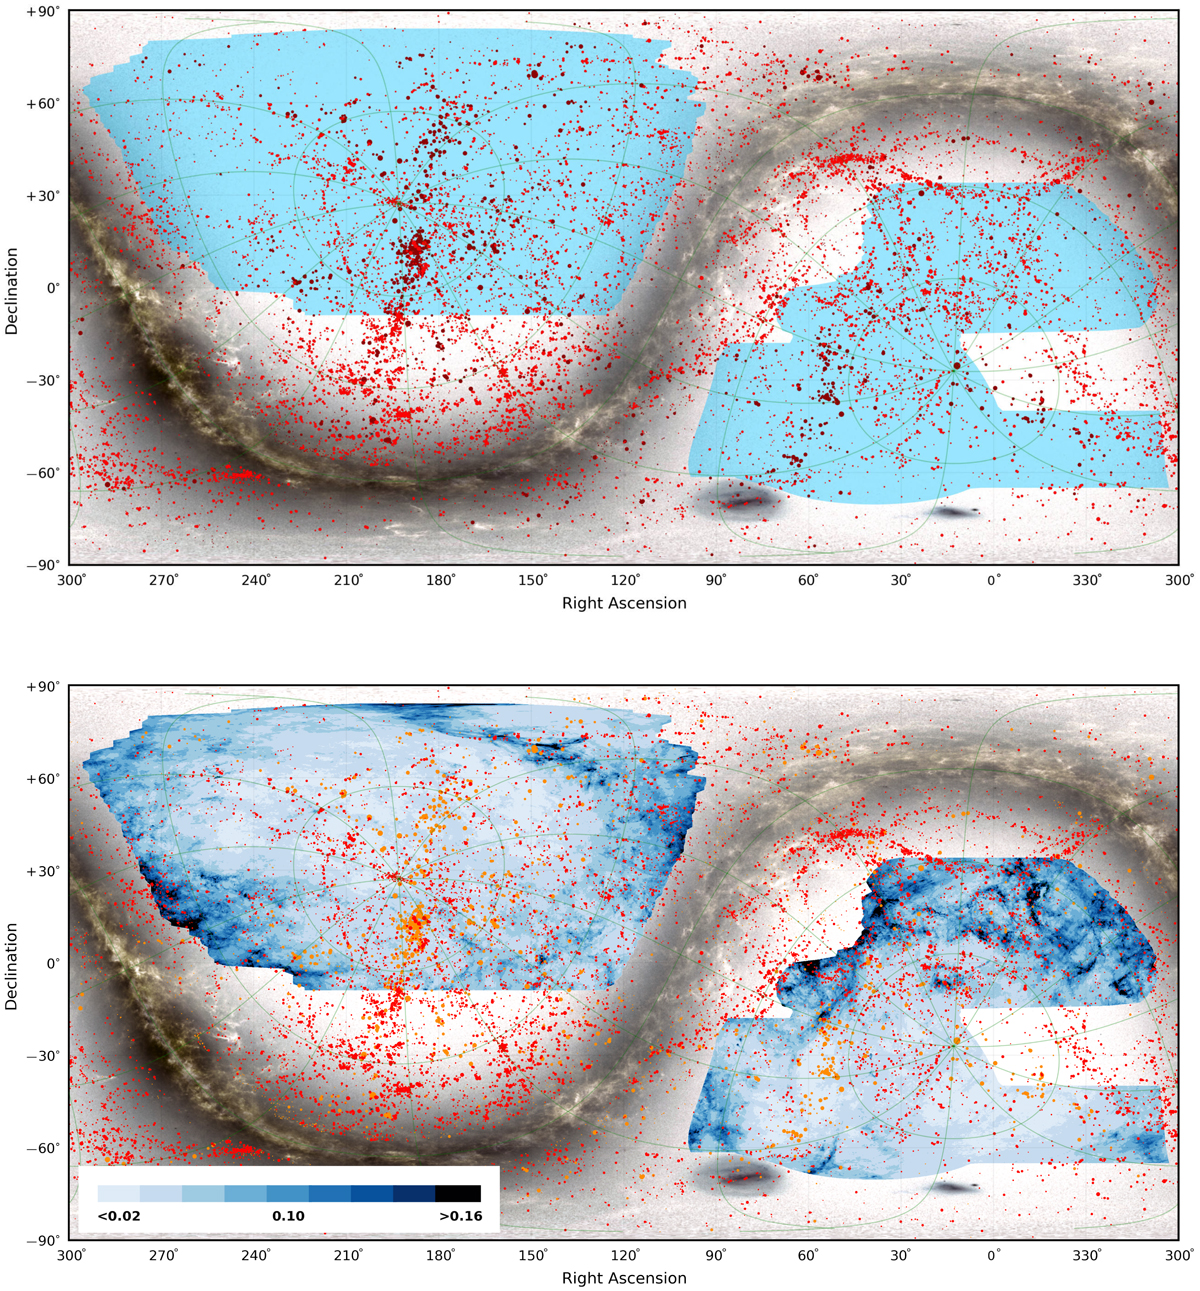
Fig. 1.
Download original image
The Stellar Stream Legacy Survey sky coverage. Top: The DESI Legacy Imaging Surveys footprint (blue), the source of optical data for our survey. The 2MASS Redshift Survey catalogue (Huchra et al. 2012) beyond the local group and below VLG < 7000 km s−1 is plotted over the whole sky with a marker size scaled to the K-band magnitude. Those galaxies matching our selection criteria (2000 < VLG < 7000 km s−1, K-band absolute magnitude MK < −19.6) are displayed in bright red colour. The Stellar Stream Legacy Survey sub-samples comprise approximately 3000 of these galaxies in bright red within the blue area. Low galactic latitude regions of the survey affected by the higher stellar density of the Galaxy are perceived with this Gaia overlay. The galactic referential is plotted in green. Bottom: E(B − V) distribution across the DESI Legacy Imaging Surveys footprint (Planck Collaboration XI 2014). Areas of greater dust density (dark blue) are also contaminated with the Galactic light diffused by the dust grains (galactic cirrus) causing a slightly higher background and occasional overlapping structures at scales similar to the faint streams motivating this study. The same 2MRS galaxies are represented on this second map with a different colour scheme.
Current usage metrics show cumulative count of Article Views (full-text article views including HTML views, PDF and ePub downloads, according to the available data) and Abstracts Views on Vision4Press platform.
Data correspond to usage on the plateform after 2015. The current usage metrics is available 48-96 hours after online publication and is updated daily on week days.
Initial download of the metrics may take a while.