Fig. B.2
Download original image
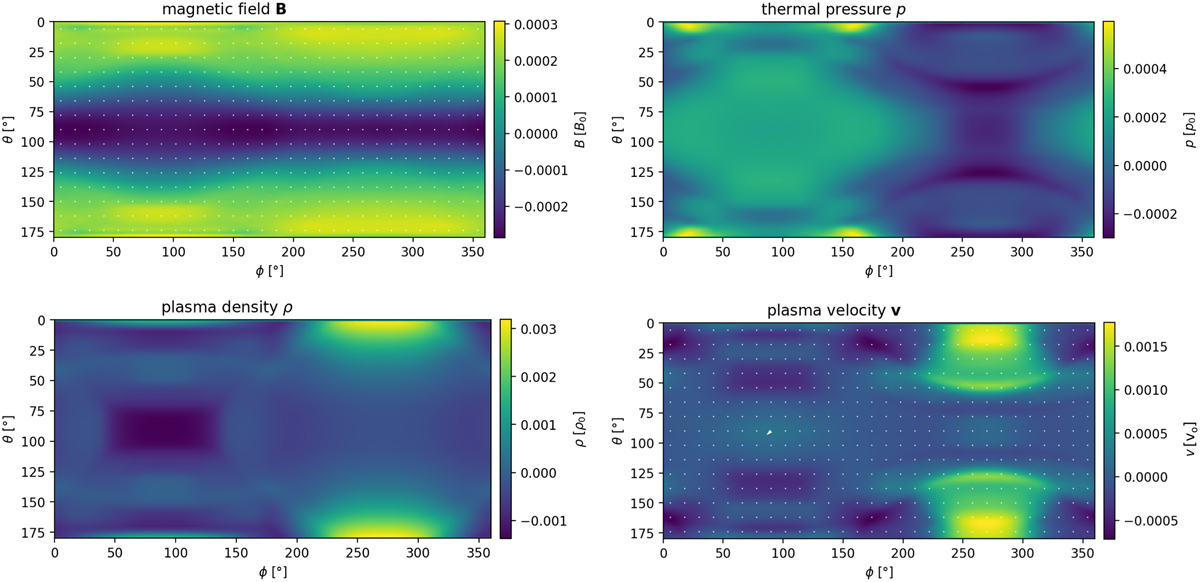
Deviations of resistive MHD simulations from the simulations discussed in the main text using the basic model (Table 1). The results correspond to simulations with a Pedersen conductance of 1S. The four panels display magnetic field (upper left), pressure (upper right), density (bottom left), and velocity (bottom right) maps at r = 2Rp.
Current usage metrics show cumulative count of Article Views (full-text article views including HTML views, PDF and ePub downloads, according to the available data) and Abstracts Views on Vision4Press platform.
Data correspond to usage on the plateform after 2015. The current usage metrics is available 48-96 hours after online publication and is updated daily on week days.
Initial download of the metrics may take a while.