Fig. 6

Download original image
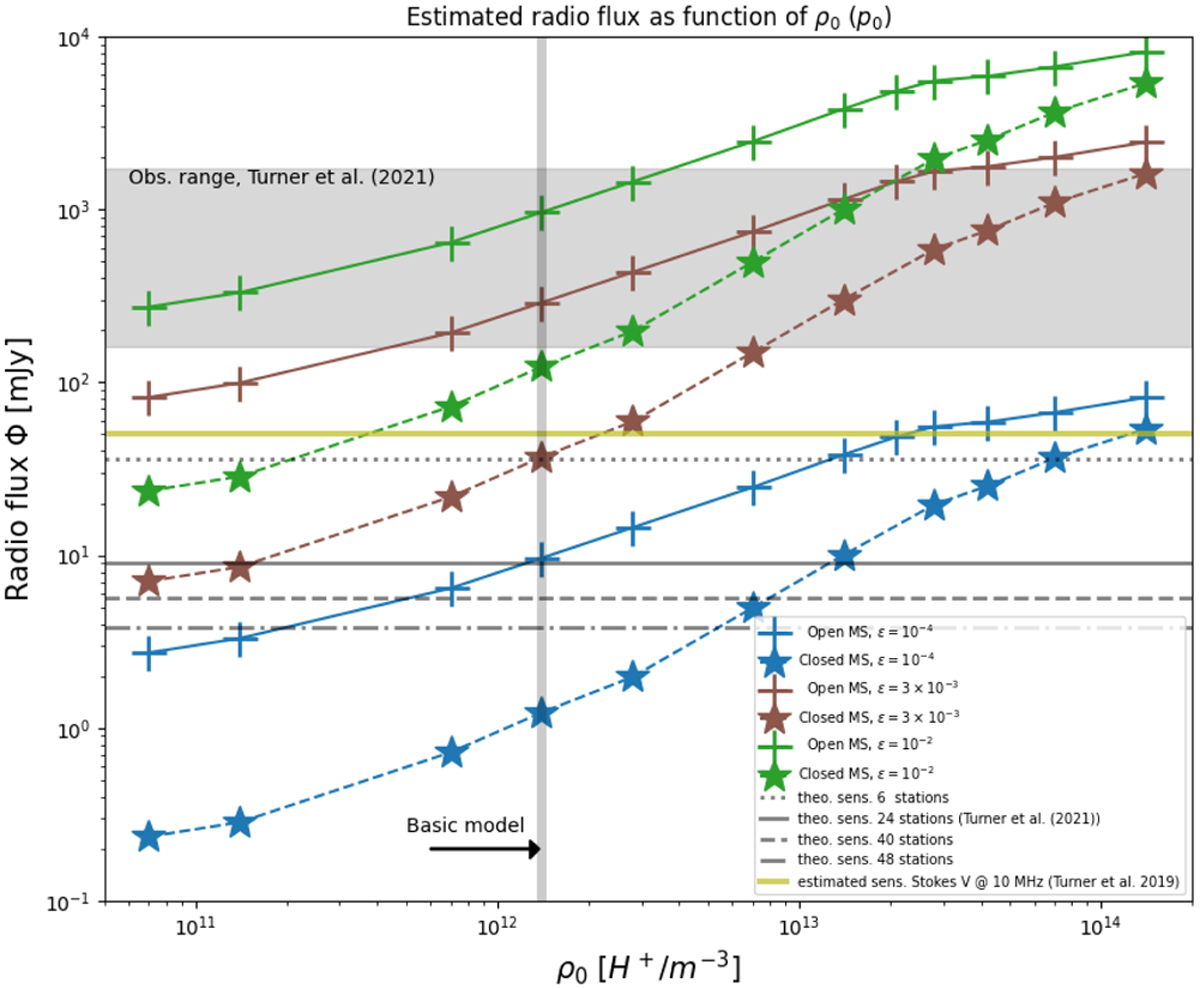
Radio flux (Eq. (20)) as a function of stellar wind density and pressure for different efficiency factors. Colored solid and dashed lines represent fluxes for the open and closed MS models. Observational limits (Turner et al. 2021) are indicated by the gray shaded area. Horizontal gray lines display theoretical sensitivity limits of the LOFAR telescope. The real sensitivity for Stokes V signals obtained from Turner et al. (2019) is plotted as a yellow line. The vertical gray line marks the basic model (Table 1).
Current usage metrics show cumulative count of Article Views (full-text article views including HTML views, PDF and ePub downloads, according to the available data) and Abstracts Views on Vision4Press platform.
Data correspond to usage on the plateform after 2015. The current usage metrics is available 48-96 hours after online publication and is updated daily on week days.
Initial download of the metrics may take a while.


