Fig. 4
Download original image
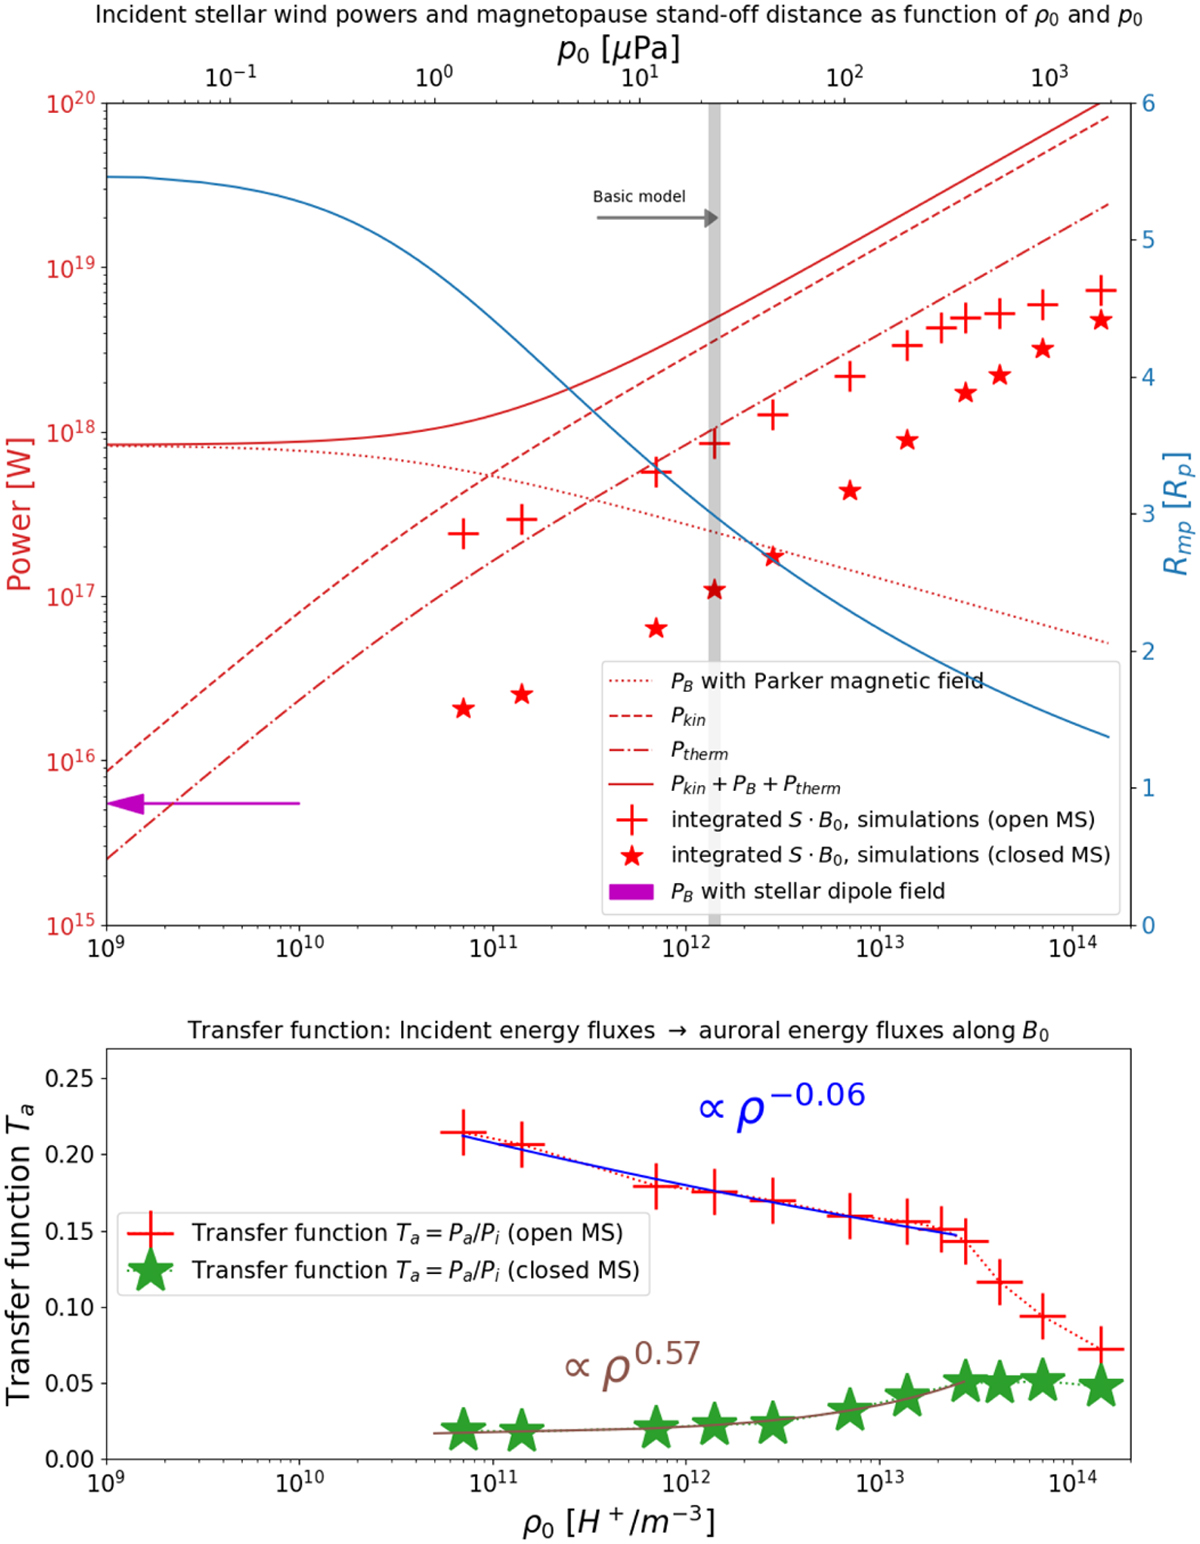
Incident energy fluxes and auroral Poynting fluxes as a function of stellar wind density and pressure. Top: analytically calculated incident kinetic (dashed red line), Poynting (dotted red line), and thermal (dashed-dotted red line) energy fluxes convected through the magnetospheric cross section, ![]() , as a function of stellar wind density at the position of τ Boötis b. The pressure varies accordingly as p0 ∝ ρ0 (see Table 1 for the basic stellar wind model). The powers are calculated using Eqs. (13)–(15) and (17). The solid red line represents the sum of the three energy components. The MS stand-off distance, Rmp (solid blue line) is calculated with the same set of ρ0 and p0 using Eq. (16). The stand-off distance can be obtained from the right y-axis, given in terms of planetary radii, Rp. The magenta arrow indicates the convected power in the limiting case where the plasma density in the astrosphere approaches zero and the planet is only exposed to the stellar dipole field (see Sect. 4.1.2 for discussion of this case). Red crosses show simulated Poynting fluxes along the unperturbed magnetic field over a spherical shell with radius 2Rp for the closed MS (Eq. (12)). Red stars indicate simulated Poynting fluxes for the closed MS. Bottom: Transfer function Ta = Pa/Pi as a function of ρ0 and p0 (i.e., the conversion from incident energy to auroral Poynting fluxes). The scaling behavior according to power laws of Ta is indicated by spectral indices above the lines.
, as a function of stellar wind density at the position of τ Boötis b. The pressure varies accordingly as p0 ∝ ρ0 (see Table 1 for the basic stellar wind model). The powers are calculated using Eqs. (13)–(15) and (17). The solid red line represents the sum of the three energy components. The MS stand-off distance, Rmp (solid blue line) is calculated with the same set of ρ0 and p0 using Eq. (16). The stand-off distance can be obtained from the right y-axis, given in terms of planetary radii, Rp. The magenta arrow indicates the convected power in the limiting case where the plasma density in the astrosphere approaches zero and the planet is only exposed to the stellar dipole field (see Sect. 4.1.2 for discussion of this case). Red crosses show simulated Poynting fluxes along the unperturbed magnetic field over a spherical shell with radius 2Rp for the closed MS (Eq. (12)). Red stars indicate simulated Poynting fluxes for the closed MS. Bottom: Transfer function Ta = Pa/Pi as a function of ρ0 and p0 (i.e., the conversion from incident energy to auroral Poynting fluxes). The scaling behavior according to power laws of Ta is indicated by spectral indices above the lines.
Current usage metrics show cumulative count of Article Views (full-text article views including HTML views, PDF and ePub downloads, according to the available data) and Abstracts Views on Vision4Press platform.
Data correspond to usage on the plateform after 2015. The current usage metrics is available 48-96 hours after online publication and is updated daily on week days.
Initial download of the metrics may take a while.