Fig. D.2
Download original image
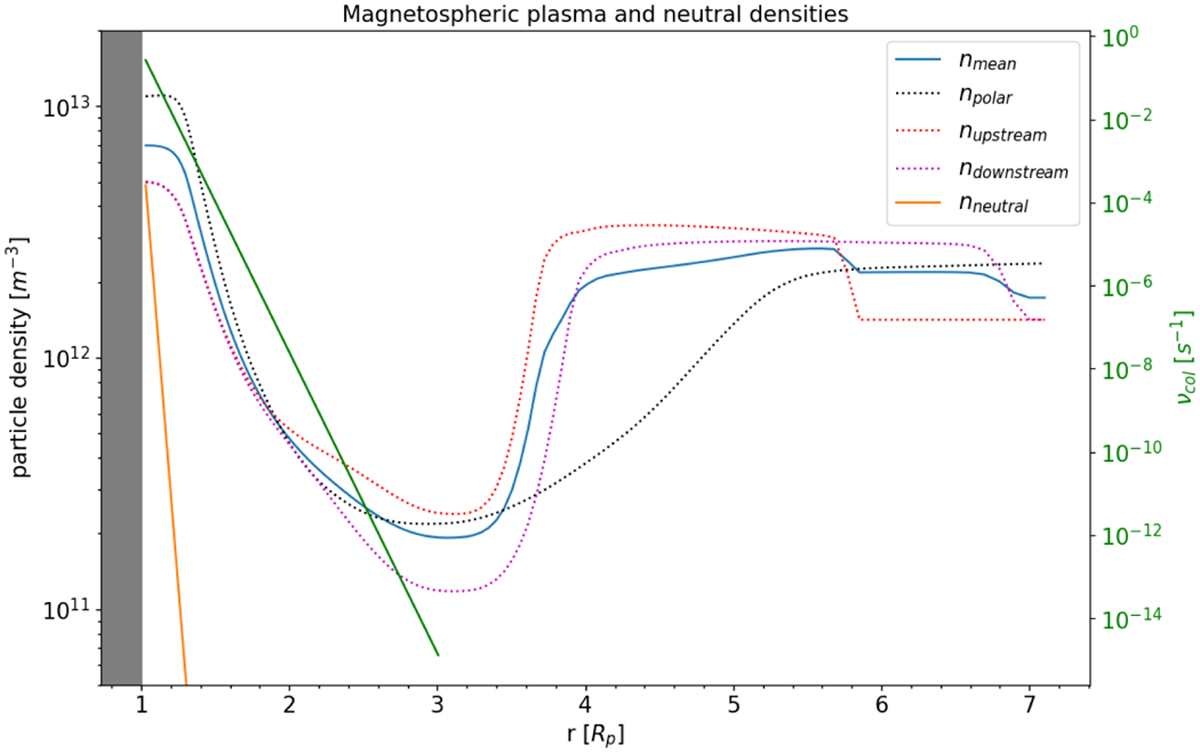
Plasma density profiles along the polar axis (dotted black line), upstream (red), and downstream x-axis (magenta). The solid blue line denotes the mean plasma density profile. The solid orange line shows the neutral particle density according to our atmosphere model (Eq. 5). The solid green line (right y-axis) denotes ion-neutral collision frequencies.
Current usage metrics show cumulative count of Article Views (full-text article views including HTML views, PDF and ePub downloads, according to the available data) and Abstracts Views on Vision4Press platform.
Data correspond to usage on the plateform after 2015. The current usage metrics is available 48-96 hours after online publication and is updated daily on week days.
Initial download of the metrics may take a while.