Fig. 8.
Download original image
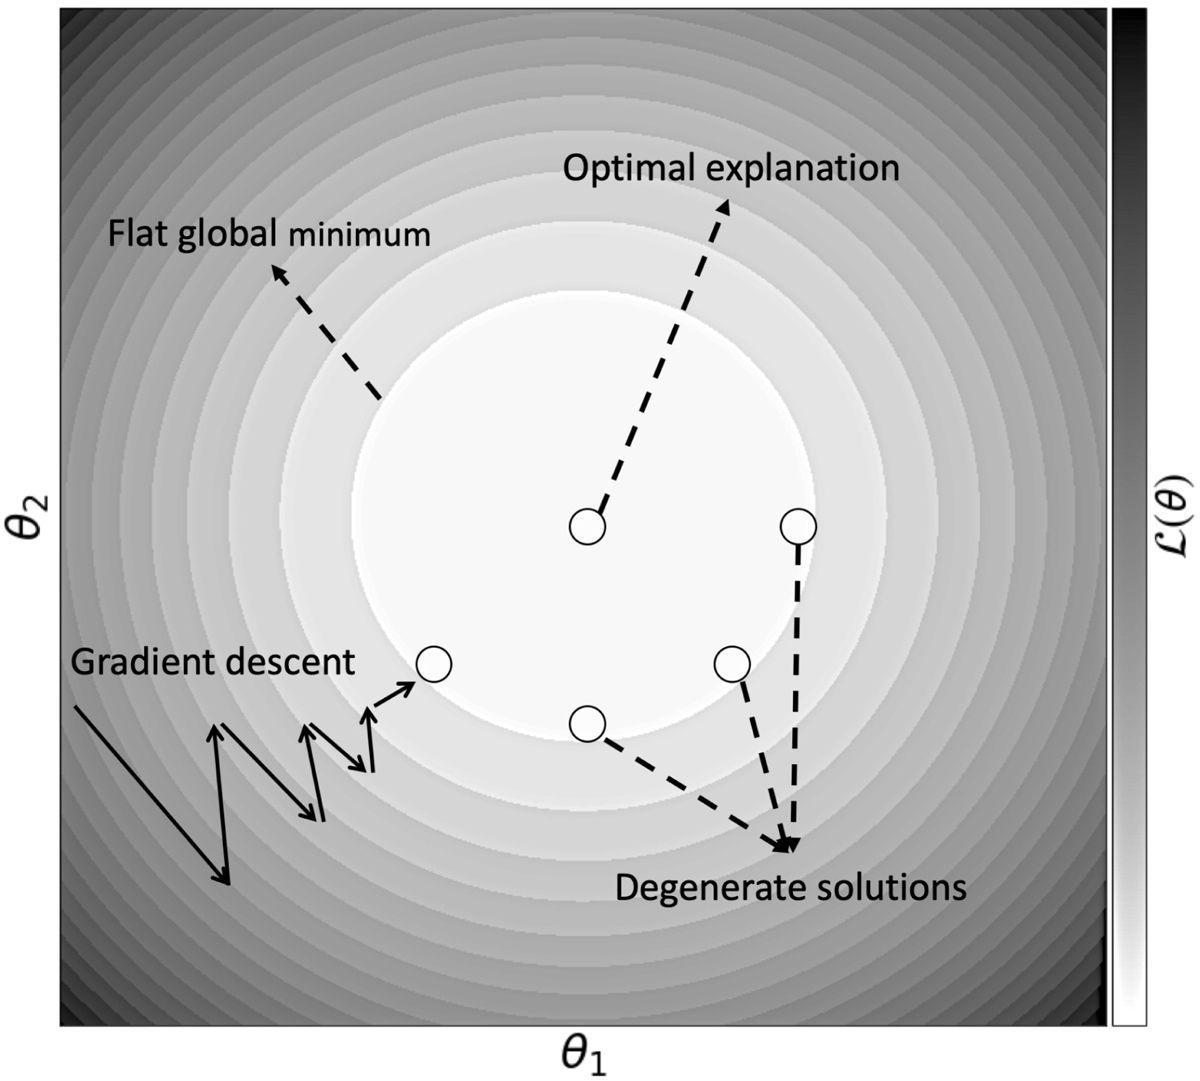
Schematic indicating the problem of obtaining the optimal solution both in terms of model performance and explanatory power. The x- and y-axis represent the parameters of a fictitious two parameter model. Adjusting the model parameters affects the loss, which we ideally want to minimize (lighter regions). Gradient descent allows us to converge to the global minimum in a controlled manner, however, there might be multiple solutions (as indicated by the white circles) that have the same loss. Although these points are degenerate in terms of model performance, they do not all have the same explanatory power. We postulate that the best explanation is located at the center of gravity of this degenerate space. This point must be located stochastically by initiating several models and then taking the average.
Current usage metrics show cumulative count of Article Views (full-text article views including HTML views, PDF and ePub downloads, according to the available data) and Abstracts Views on Vision4Press platform.
Data correspond to usage on the plateform after 2015. The current usage metrics is available 48-96 hours after online publication and is updated daily on week days.
Initial download of the metrics may take a while.