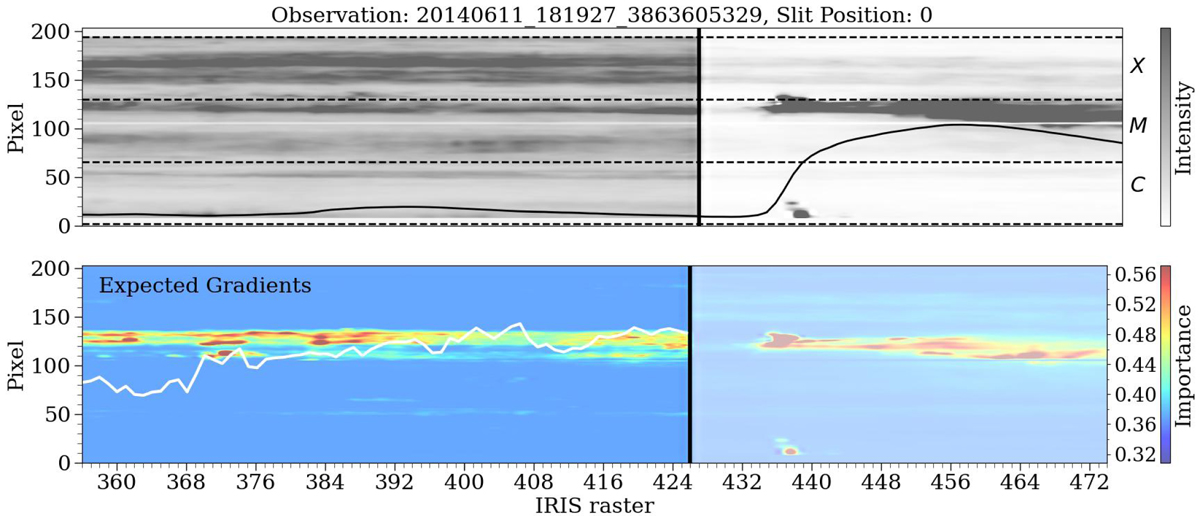
Fig. D.2.
Download original image
Same as Fig. 14, but an example of how the location of the maximum attributions along the slit in the preflare region (bottom panel, left) align with the maximum UV emission of the flare (upper panel, right). Notice that even though the intensity is larger around pixel 160, the attributions are only high around pixels 130, where the maximum UV intensity is seen later during the flare.
Current usage metrics show cumulative count of Article Views (full-text article views including HTML views, PDF and ePub downloads, according to the available data) and Abstracts Views on Vision4Press platform.
Data correspond to usage on the plateform after 2015. The current usage metrics is available 48-96 hours after online publication and is updated daily on week days.
Initial download of the metrics may take a while.