Fig. C.1.
Download original image
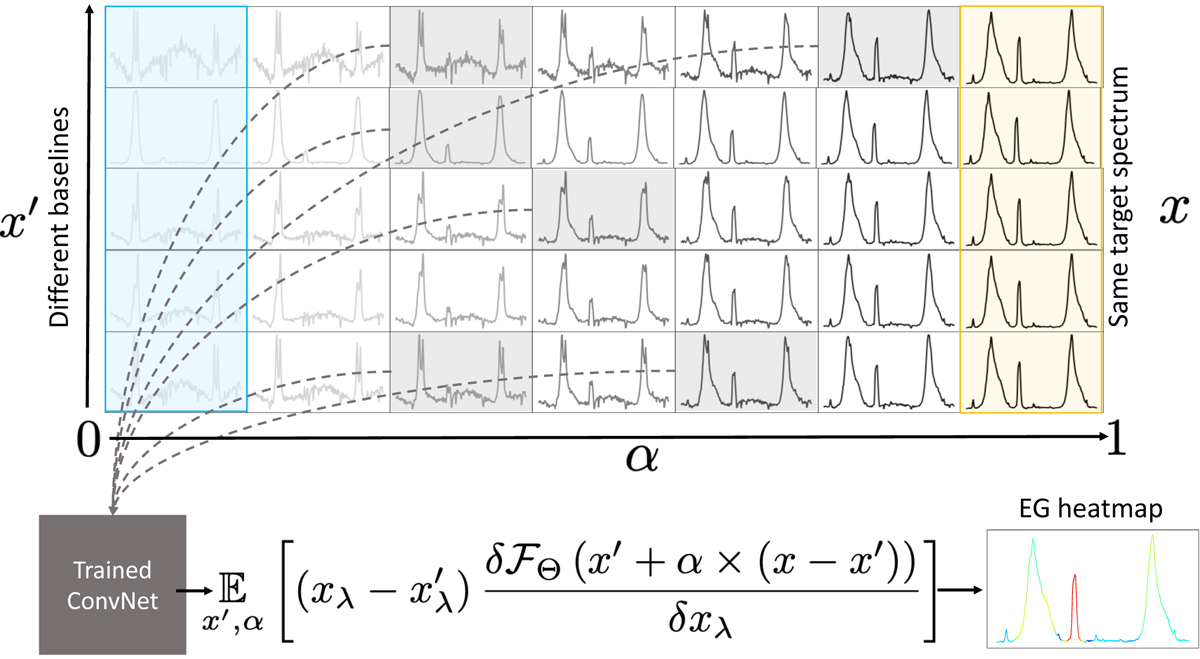
Diagram showing the calculation procedure for producing an EG heatmap. The heatmap for a target spectrum (orange) is calculated by interpolating between a set of baseline spectra (blue) and the target. As we move from left to right along each row, the interpolated spectrum in each panel is fed into the network which generates a prediction score. The wavelengths with the largest accumulated gradients along the path are then ranked as most critical for flare prediction. Instead of integrating over all paths, EG calculates an expectation value for the wavelength’s importance by feeding a random sample (gray spectra) into the network.
Current usage metrics show cumulative count of Article Views (full-text article views including HTML views, PDF and ePub downloads, according to the available data) and Abstracts Views on Vision4Press platform.
Data correspond to usage on the plateform after 2015. The current usage metrics is available 48-96 hours after online publication and is updated daily on week days.
Initial download of the metrics may take a while.