Fig. A.2.
Download original image
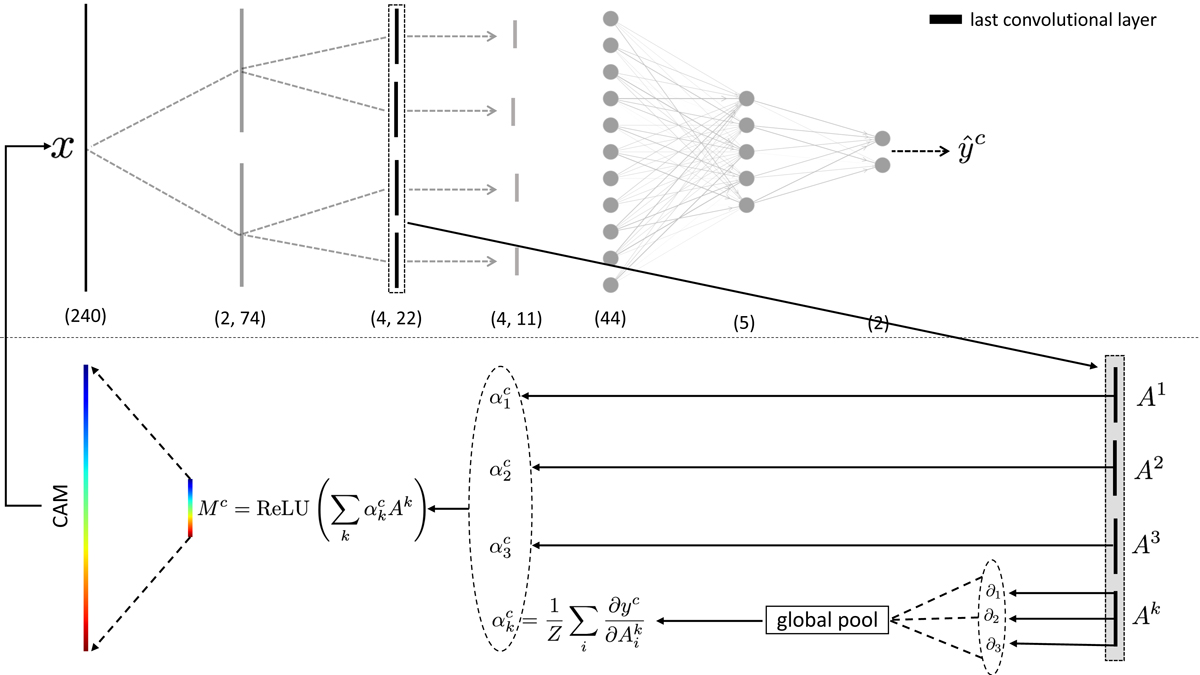
Schematic of Grad-CAM. A single spectrum x is passed into a ConvNet that has been trained to distinguish between the PF/AR datasets. The last convolutional layer before the max pooling and fully connected layers contains the network’s most sophisticated understanding of the spectrum, with each of the four feature maps Ak, focusing on different aspects deemed important for the classification task. The average gradients ![]() of the output prediction are taken with respect to each of the maps. Larger gradients indicate that the features identified by a particular map are more important for the classification. All four feature maps are then scaled by their corresponding importance and summed before being passed through a ReLU function that isolates the features the network focuses on for the positive classification. The resultant CAM heat map is then interpolated from the scale of the feature map to the dimensionality of the input data before being projected onto the spectrum.
of the output prediction are taken with respect to each of the maps. Larger gradients indicate that the features identified by a particular map are more important for the classification. All four feature maps are then scaled by their corresponding importance and summed before being passed through a ReLU function that isolates the features the network focuses on for the positive classification. The resultant CAM heat map is then interpolated from the scale of the feature map to the dimensionality of the input data before being projected onto the spectrum.
Current usage metrics show cumulative count of Article Views (full-text article views including HTML views, PDF and ePub downloads, according to the available data) and Abstracts Views on Vision4Press platform.
Data correspond to usage on the plateform after 2015. The current usage metrics is available 48-96 hours after online publication and is updated daily on week days.
Initial download of the metrics may take a while.