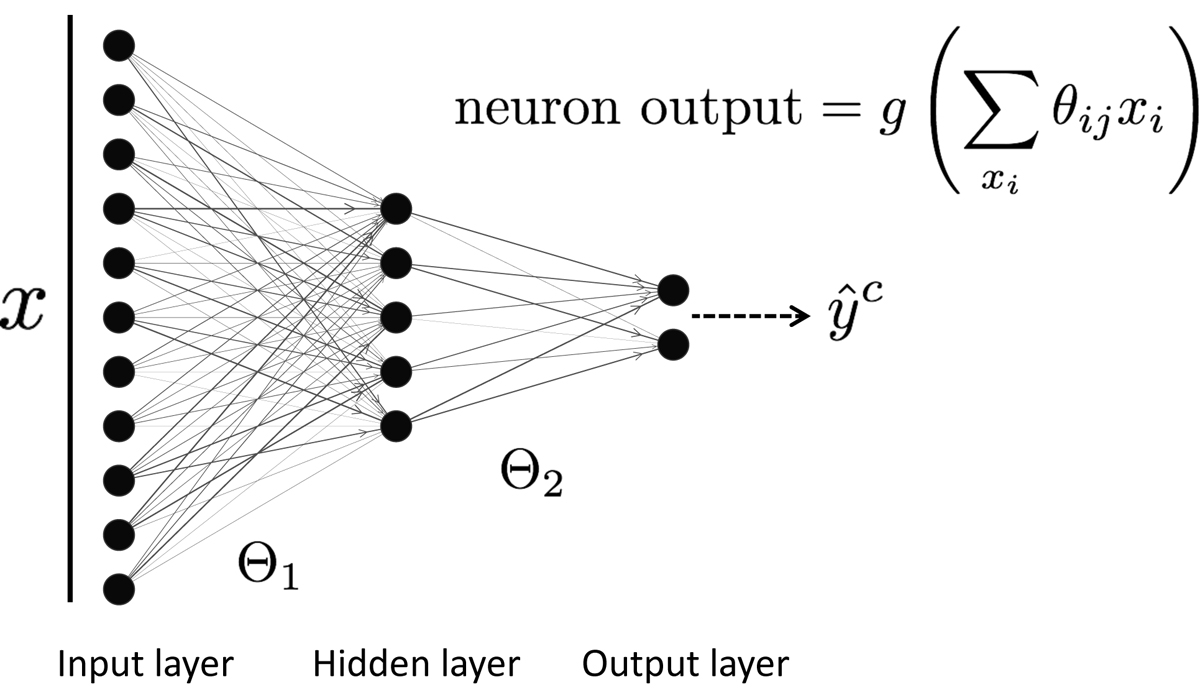
Fig. A.1.
Download original image
Schematic of a simple fully connected feed forward network. An input spectrum x is fed into the network which stimulates the hidden layer causing the neurons (black circles) to produce output signals that are proportional to the weighted linear sum of the spectrum’s intensities. The content of each neuron is then passed through a nonlinear activation function g, such as a softmax or ReLU, which allows the network to approximate a large set of complex behaviors. The process is continued with the hidden layer serving as the input layer for the final two neurons. The neuron which produces the strongest signal represents the network’s prediction on whether the spectrum comes from the AR or PF class. The weight matrices Θ1, 2 determine how information flows through the network and are updated by propagating the errors from a set of predictions back through the network, and adjusting the individual weights against a loss function via gradient descent.
Current usage metrics show cumulative count of Article Views (full-text article views including HTML views, PDF and ePub downloads, according to the available data) and Abstracts Views on Vision4Press platform.
Data correspond to usage on the plateform after 2015. The current usage metrics is available 48-96 hours after online publication and is updated daily on week days.
Initial download of the metrics may take a while.