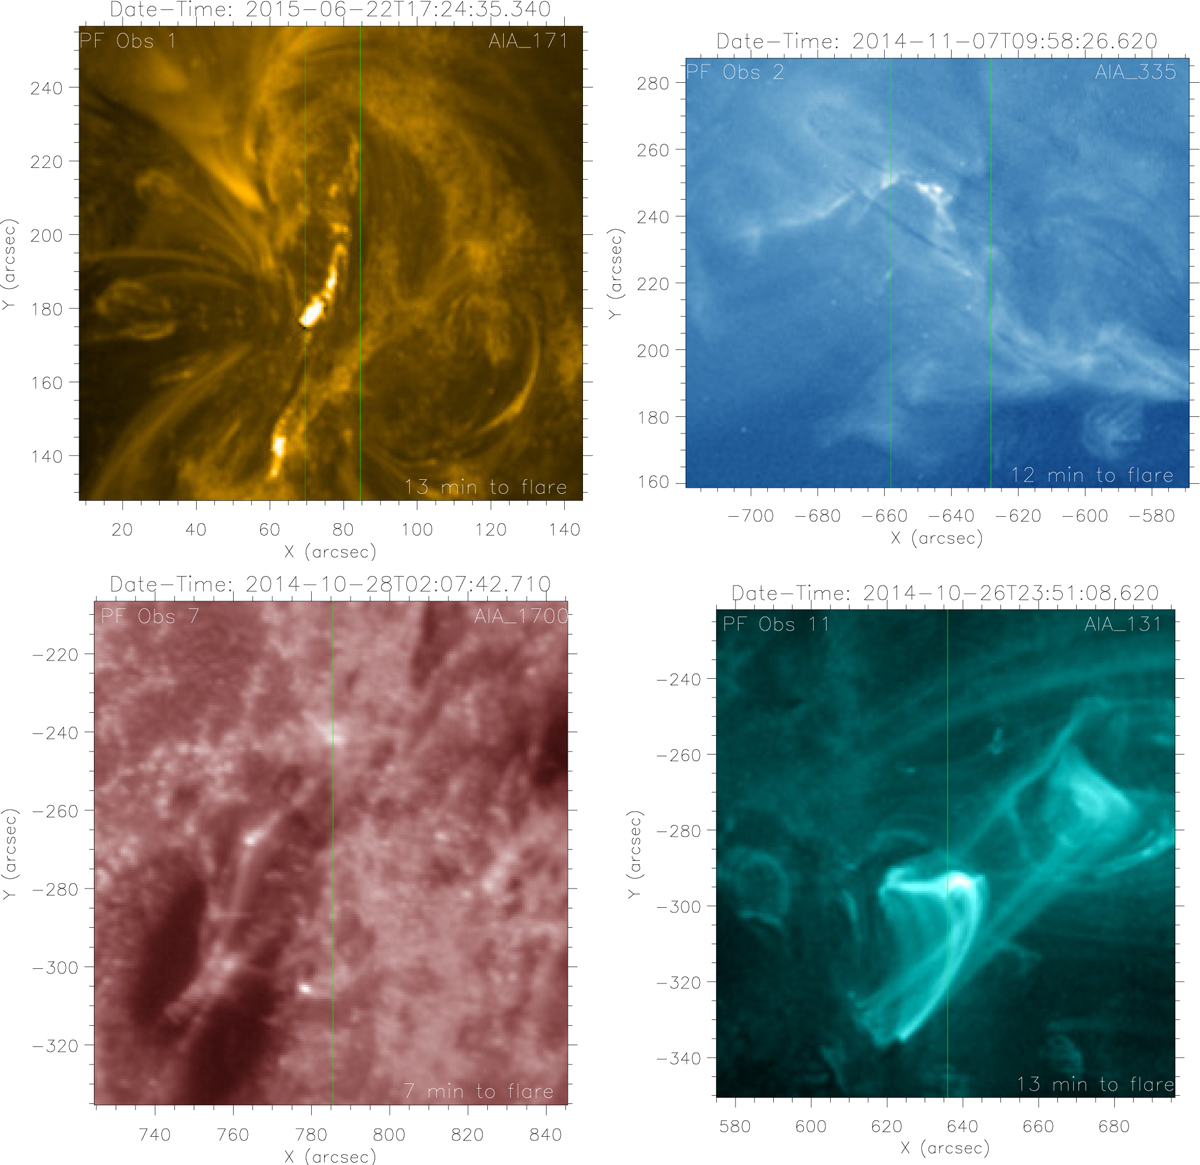
Fig. 18.
Download original image
Selected images of different PF observations in the strongly predictive regime of Fig. 17. The PF observation numbering corresponding to Table D.1, as well as the filter wavelength is indicated in the top left and right hand corners of each image, respectively. The green vertical lines indicate the span of the IRIS raster. The flares that are easiest to predict based on spectra have the slit directly over regions where brightenings occur.
Current usage metrics show cumulative count of Article Views (full-text article views including HTML views, PDF and ePub downloads, according to the available data) and Abstracts Views on Vision4Press platform.
Data correspond to usage on the plateform after 2015. The current usage metrics is available 48-96 hours after online publication and is updated daily on week days.
Initial download of the metrics may take a while.