Fig. 16.
Download original image
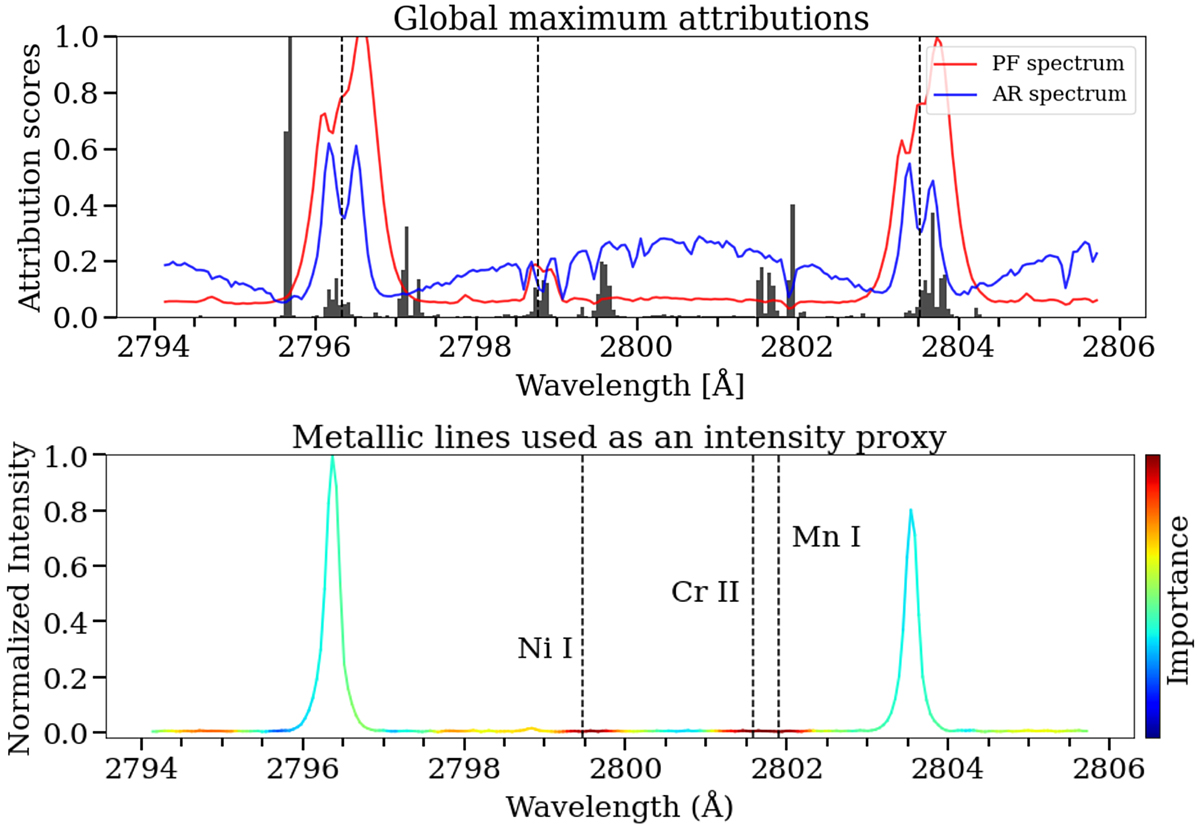
Global explanations. Upper panel: distribution (black bars) showing where the model focuses most of its attention on aggregate for the spectra that have high prediction scores. For context, a red and blue spectrum from the PF and AR class have been plotted respectively, with vertical black dashed lines indicating the positions of the line cores and triplet. Flows that show up left and right of the k-core are important as well as emission in the triplet line. Bottom panel: the model focuses on the metallic absorption lines as a proxy for intensity, since intense spectra after being normalized lead to flat pseudo continuum.
Current usage metrics show cumulative count of Article Views (full-text article views including HTML views, PDF and ePub downloads, according to the available data) and Abstracts Views on Vision4Press platform.
Data correspond to usage on the plateform after 2015. The current usage metrics is available 48-96 hours after online publication and is updated daily on week days.
Initial download of the metrics may take a while.