Open Access
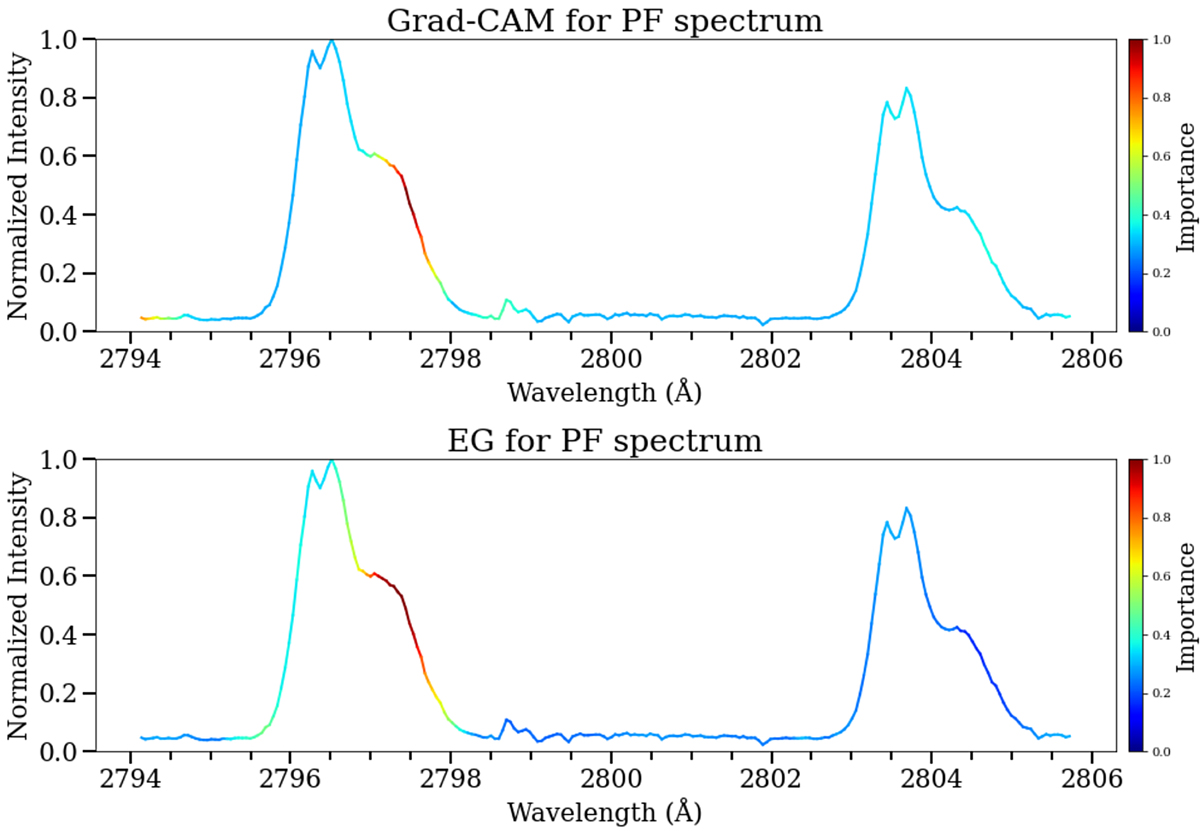
Fig. 11.
Download original image
Attributions derived using Grad-CAM (top) and Expected Gradients (bottom). Both techniques are equivalent up to an additive constant as they highlight the spectrum in a similar way. In this case, the model indicates that red wing enhancements are important signs of impending flares.
Current usage metrics show cumulative count of Article Views (full-text article views including HTML views, PDF and ePub downloads, according to the available data) and Abstracts Views on Vision4Press platform.
Data correspond to usage on the plateform after 2015. The current usage metrics is available 48-96 hours after online publication and is updated daily on week days.
Initial download of the metrics may take a while.