Fig. 10.
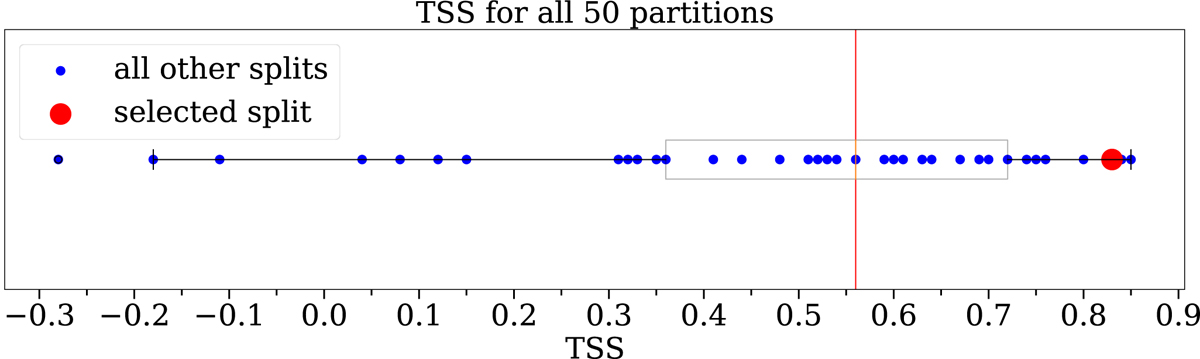
Download original image
Boxplot of the ConvNet’s performance in TSS for all 50 random partitions of the observations. The red mark represents the performance of the selected model, while the blue dots are the scores from the remaining partitions. The vertical red line is the median score of all splits, while the edges of the gray box outline the first and third quartiles, the whiskers at the end denote the min and max values while anything outside of this limit is considered to be an outlier. The plot shows that the model easily achieves a high skill on the binary classification task.
Current usage metrics show cumulative count of Article Views (full-text article views including HTML views, PDF and ePub downloads, according to the available data) and Abstracts Views on Vision4Press platform.
Data correspond to usage on the plateform after 2015. The current usage metrics is available 48-96 hours after online publication and is updated daily on week days.
Initial download of the metrics may take a while.