Fig. 8.
Download original image
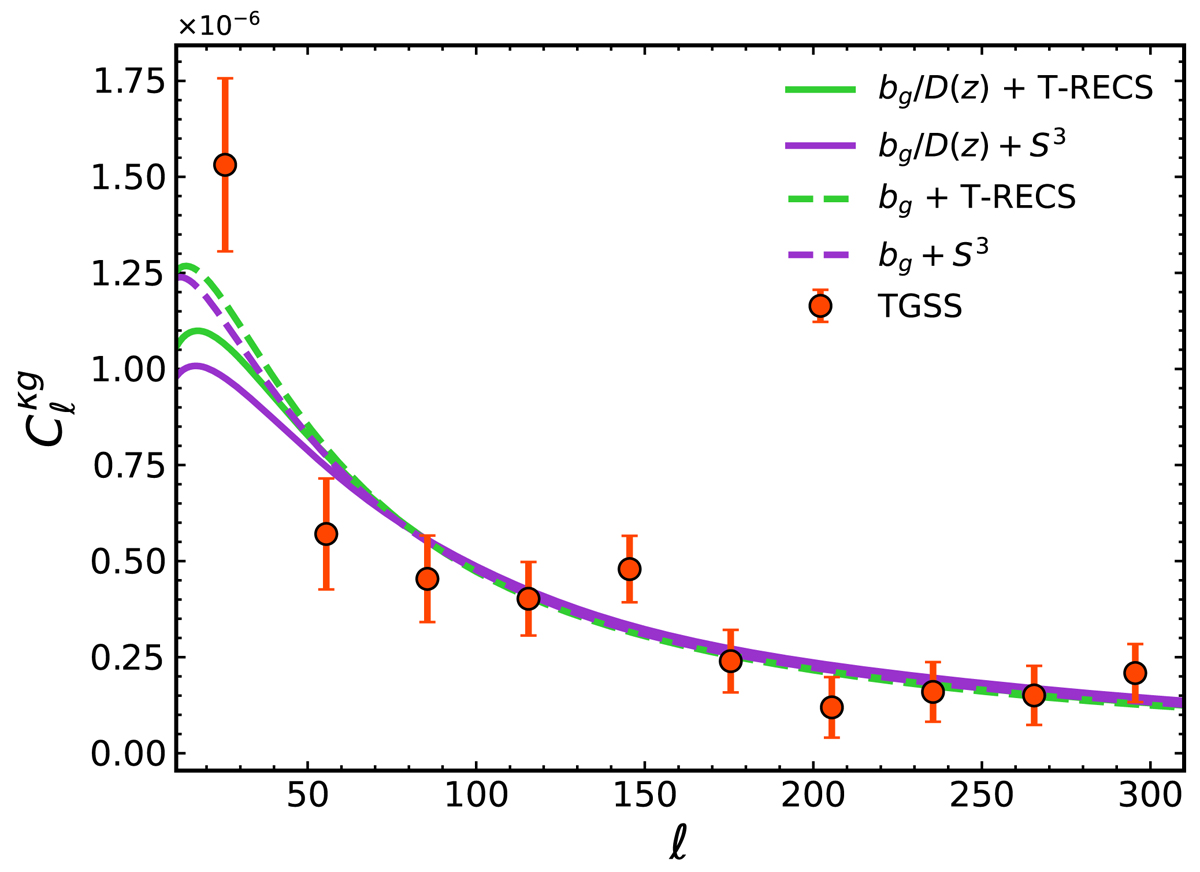
Best-fit κg power spectra models for the TGSS sample (solid and dashed lines) vs. measured (red dots) and their 1σ Gaussian error bars. Different colors and line styles are used for the different redshift distribution models: N(z) from T-RECS (green) and N(z) from S3 (purple). Continuous lines refer to a linearly evolving bias (model 1) while dashed lines to a constant bias (model 2). The best fitting bg values are listed in Table 6.
Current usage metrics show cumulative count of Article Views (full-text article views including HTML views, PDF and ePub downloads, according to the available data) and Abstracts Views on Vision4Press platform.
Data correspond to usage on the plateform after 2015. The current usage metrics is available 48-96 hours after online publication and is updated daily on week days.
Initial download of the metrics may take a while.