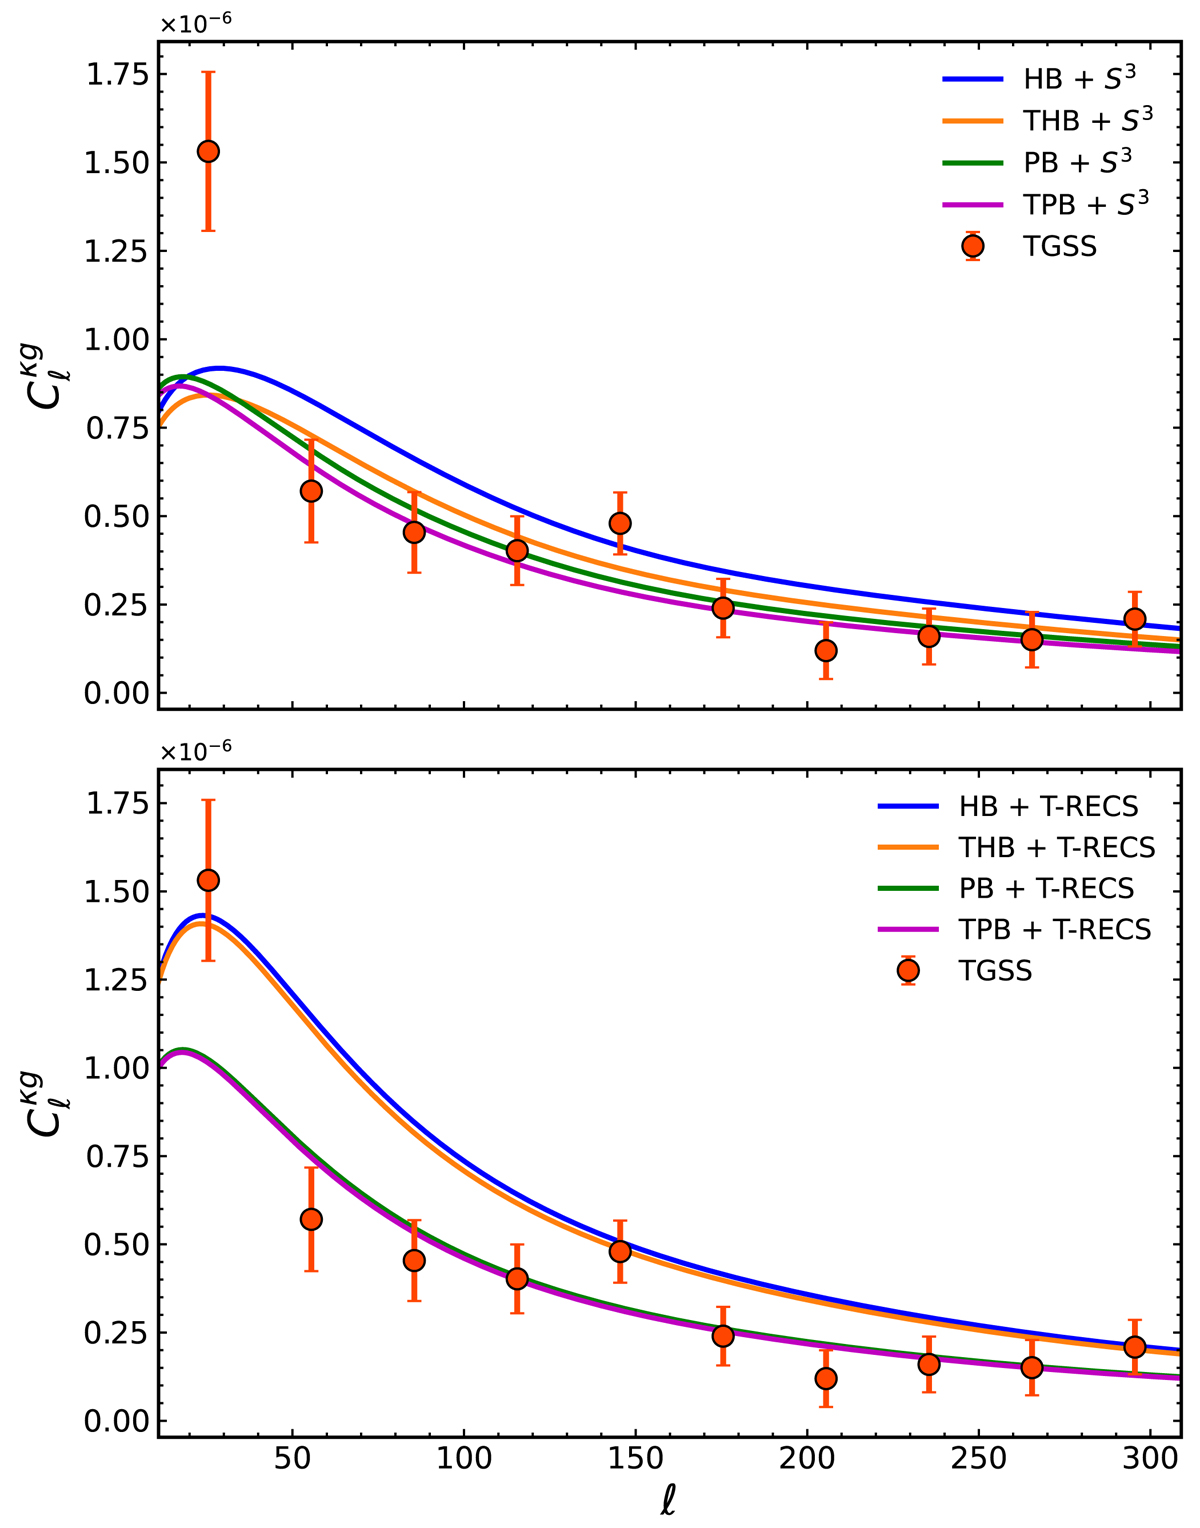
Fig. 6.
Download original image
κg cross-spectrum analysis for the TGSS sample. Red dots represent the estimated power spectrum while error bars correspond to 1σ Gaussian uncertainties. Curves with different colors are theoretical predictions of different b(z)+N(z) combinations, as specified by the labels. Top panel: models that use the S3N(z). Bottom panel: models that use the T-RECS N(z) predictions.
Current usage metrics show cumulative count of Article Views (full-text article views including HTML views, PDF and ePub downloads, according to the available data) and Abstracts Views on Vision4Press platform.
Data correspond to usage on the plateform after 2015. The current usage metrics is available 48-96 hours after online publication and is updated daily on week days.
Initial download of the metrics may take a while.