Fig. 2.
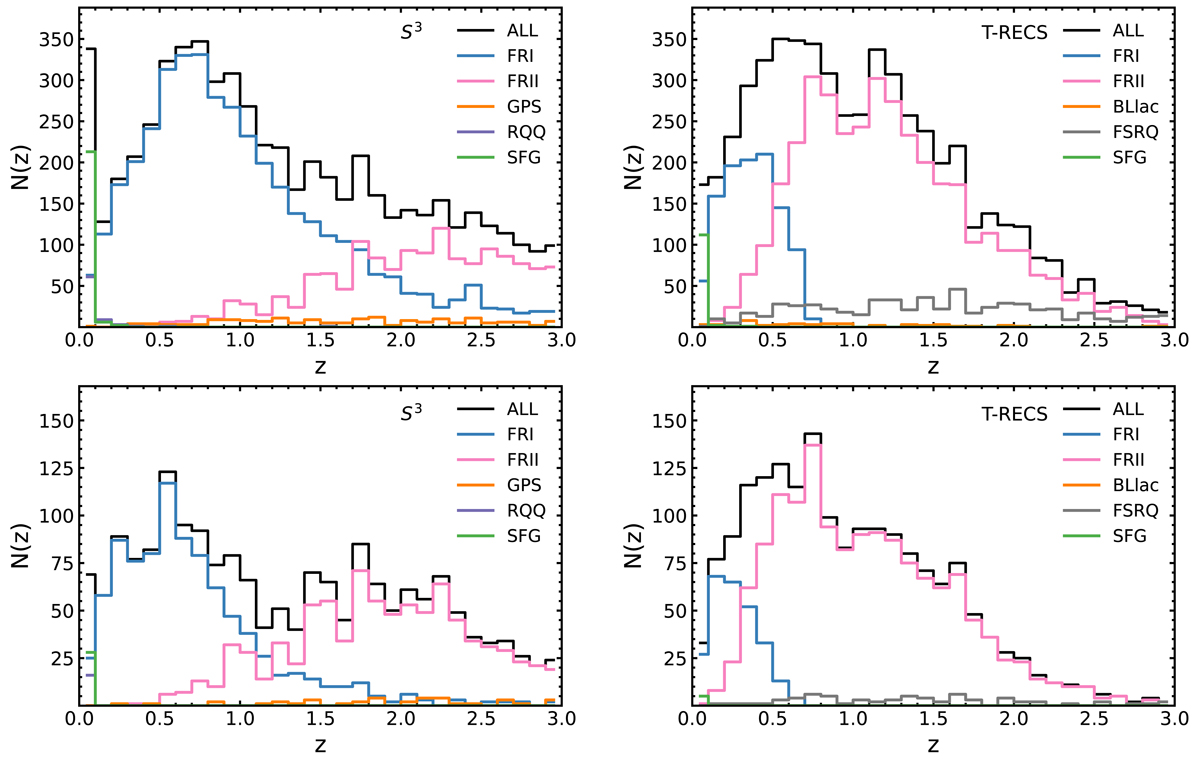
Download original image
Redshift distribution models, N(z), for the NVSS (top panels) and TGSS catalogs (bottom panels) shown in the range z = [0, 3]. Predictions from the S3 simulator are shown to the left and T-RECS to the right. The thick black histogram in each panel shows the distributions of all sources in the catalog. Histograms with different colors indicate the distribution of each object type identified by the labels.
Current usage metrics show cumulative count of Article Views (full-text article views including HTML views, PDF and ePub downloads, according to the available data) and Abstracts Views on Vision4Press platform.
Data correspond to usage on the plateform after 2015. The current usage metrics is available 48-96 hours after online publication and is updated daily on week days.
Initial download of the metrics may take a while.