Fig. B.2.
Download original image
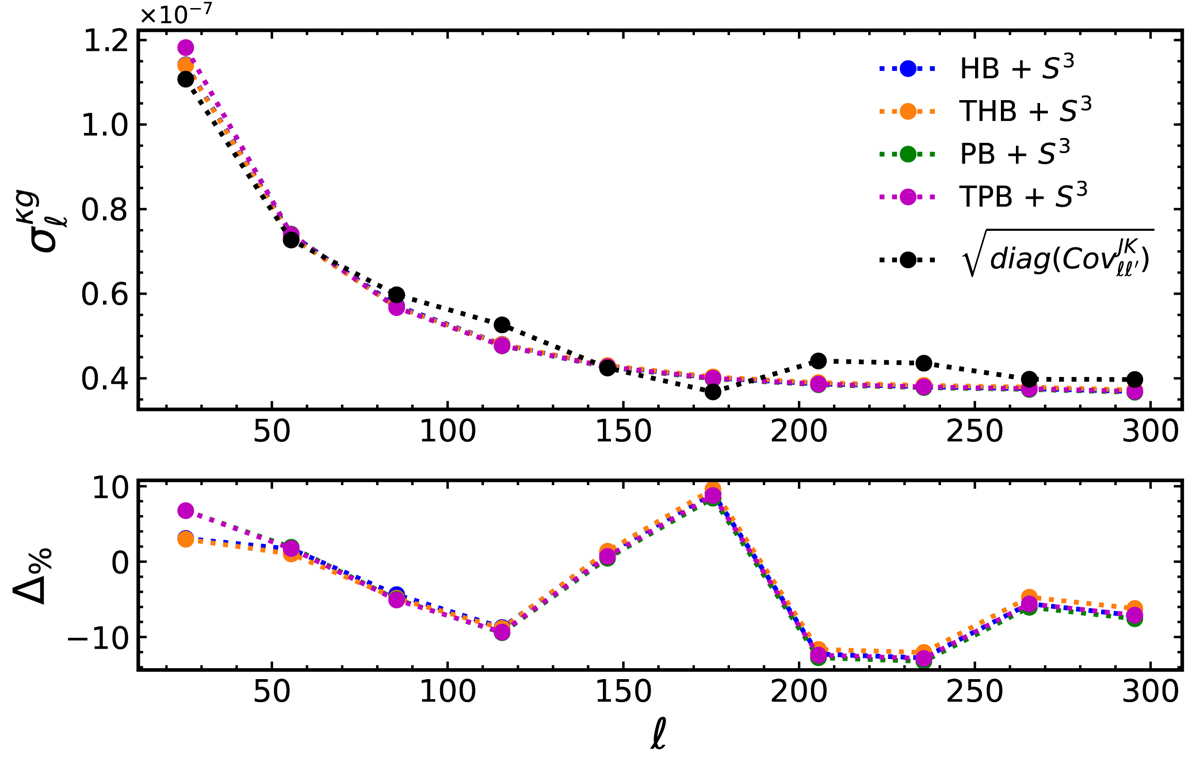
Gaussian vs. JK errors for the κg NVSS cross-spectrum estimated in bins Δℓ = 30 in the range 11 ≤ ℓ ≤ 310. Upper panel: Gaussian errors for different b(z)+N(z) model combinations, specified in the labels, shown as colored dots and dashed curves. Black dots and dashed curve indicate JK errors. Errors have been estimated from the diagonal elements of the Gaussian covariance (Eq. 18) and JK covariance (Eq. B.1). Bottom panel: Per cent difference between the Gaussian and JK errors.
Current usage metrics show cumulative count of Article Views (full-text article views including HTML views, PDF and ePub downloads, according to the available data) and Abstracts Views on Vision4Press platform.
Data correspond to usage on the plateform after 2015. The current usage metrics is available 48-96 hours after online publication and is updated daily on week days.
Initial download of the metrics may take a while.