Fig. 15.
Download original image
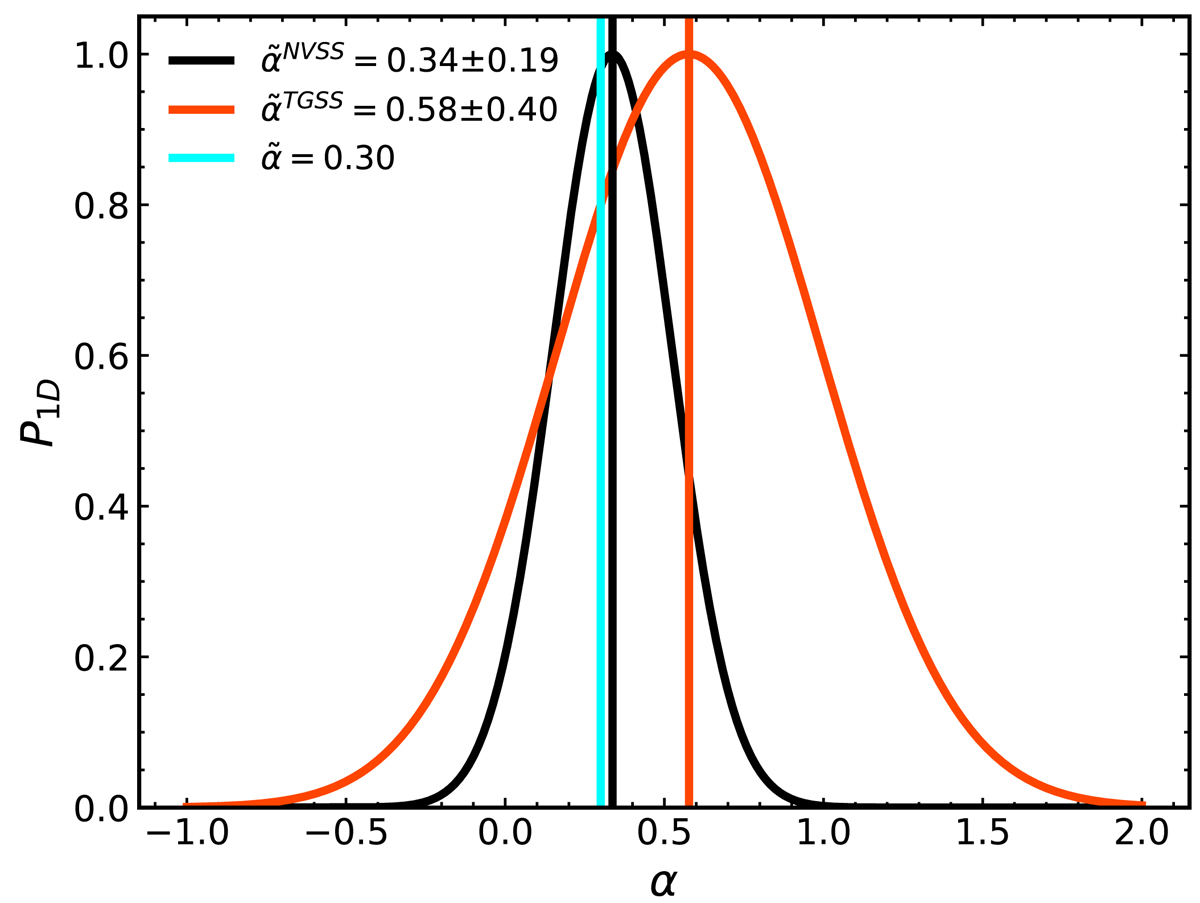
Probability distribution functions for the magnification bias parameter, ![]() , obtained from the NVSS (black curve) and TGSS (red curve) κg cross-spectra analysis. The probabilities are normalized with respect to the maximum. Positions of the maxima are flagged by vertical lines. The cyan line indicates the baseline
, obtained from the NVSS (black curve) and TGSS (red curve) κg cross-spectra analysis. The probabilities are normalized with respect to the maximum. Positions of the maxima are flagged by vertical lines. The cyan line indicates the baseline ![]() value used throughout this work.
value used throughout this work.
Current usage metrics show cumulative count of Article Views (full-text article views including HTML views, PDF and ePub downloads, according to the available data) and Abstracts Views on Vision4Press platform.
Data correspond to usage on the plateform after 2015. The current usage metrics is available 48-96 hours after online publication and is updated daily on week days.
Initial download of the metrics may take a while.