Fig. 12.
Download original image
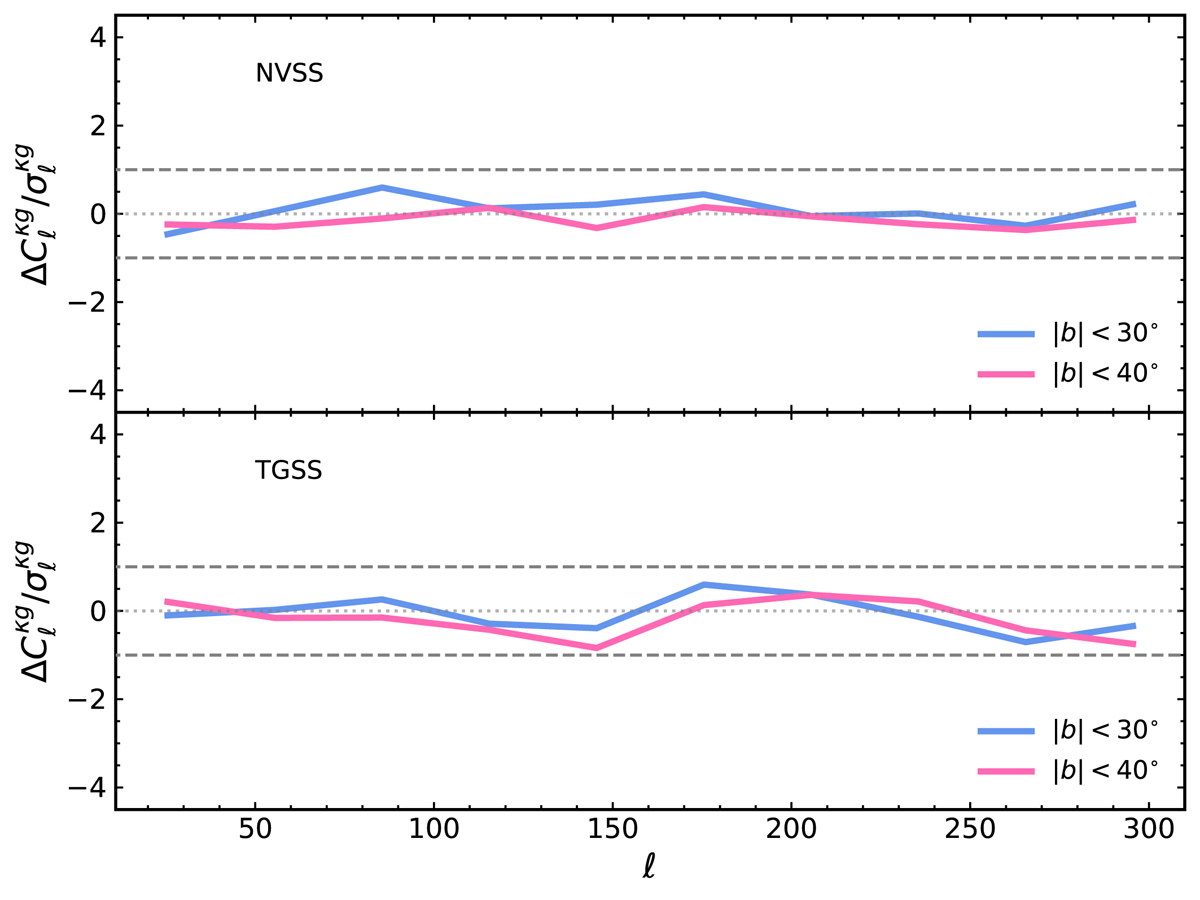
Residuals, ![]() , between cross-spectra estimated with the baseline mask and those computed with the more conservative masks featuring Galactic latitude cuts |b|< 30° (blue curve) and |b|< 40° (magenta). Residuals on the y-axis are in units of the Gaussian random errors, whose 1σ level is plotted for reference as a horizontal dashed line. The top and bottom panels show the results for the NVSS and TGSS cases.
, between cross-spectra estimated with the baseline mask and those computed with the more conservative masks featuring Galactic latitude cuts |b|< 30° (blue curve) and |b|< 40° (magenta). Residuals on the y-axis are in units of the Gaussian random errors, whose 1σ level is plotted for reference as a horizontal dashed line. The top and bottom panels show the results for the NVSS and TGSS cases.
Current usage metrics show cumulative count of Article Views (full-text article views including HTML views, PDF and ePub downloads, according to the available data) and Abstracts Views on Vision4Press platform.
Data correspond to usage on the plateform after 2015. The current usage metrics is available 48-96 hours after online publication and is updated daily on week days.
Initial download of the metrics may take a while.