Fig. 11.
Download original image
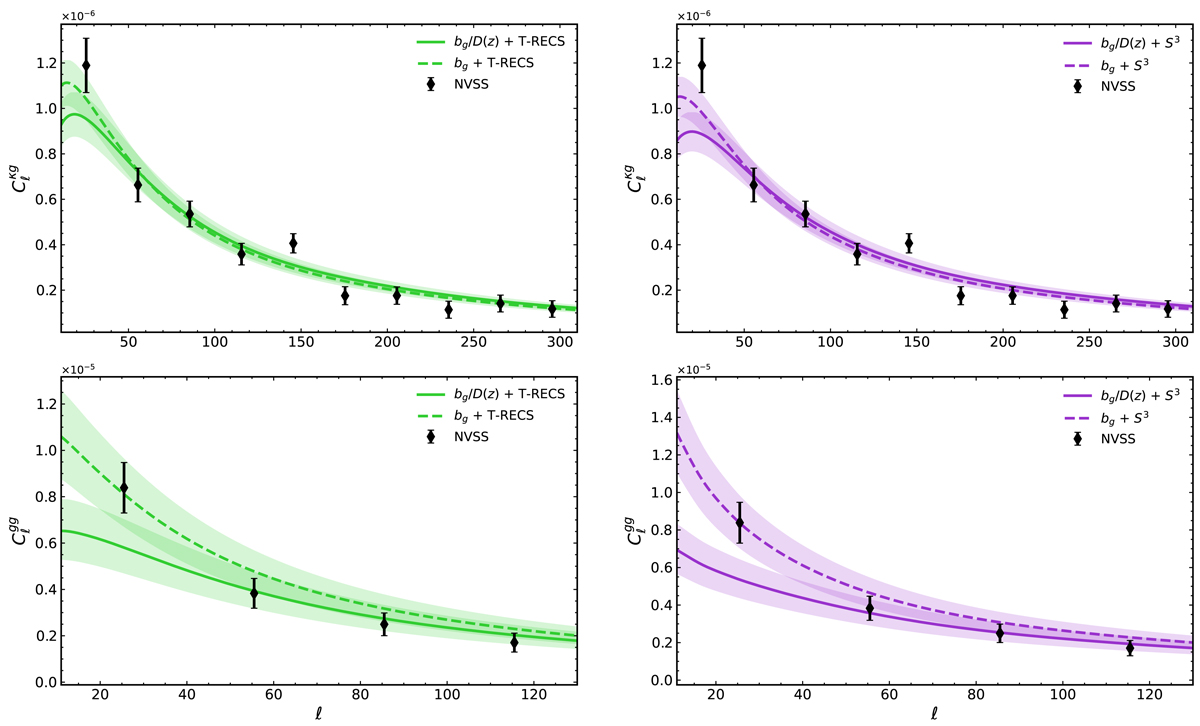
Model vs. measured NVSS κg (top panels) and gg (bottom panels) angular power spectra. The measured cross-spectra (top panels) are the same as in the previous plots. Error bars represent 1σ Gaussian uncertainties. The curves show model predictions. They are surrounded by shaded areas that represent the 2σ uncertainty interval of the best fitting bg values. The green color in the left panels indicates models that adopt the T-RECS N(z) prescription. The purple color flags the adoption of the S3 model in the right panels. Continuous and dashed lines are used for bias model 1 and model 2, respectively. All best fitting bg values are listed in Table 8.
Current usage metrics show cumulative count of Article Views (full-text article views including HTML views, PDF and ePub downloads, according to the available data) and Abstracts Views on Vision4Press platform.
Data correspond to usage on the plateform after 2015. The current usage metrics is available 48-96 hours after online publication and is updated daily on week days.
Initial download of the metrics may take a while.