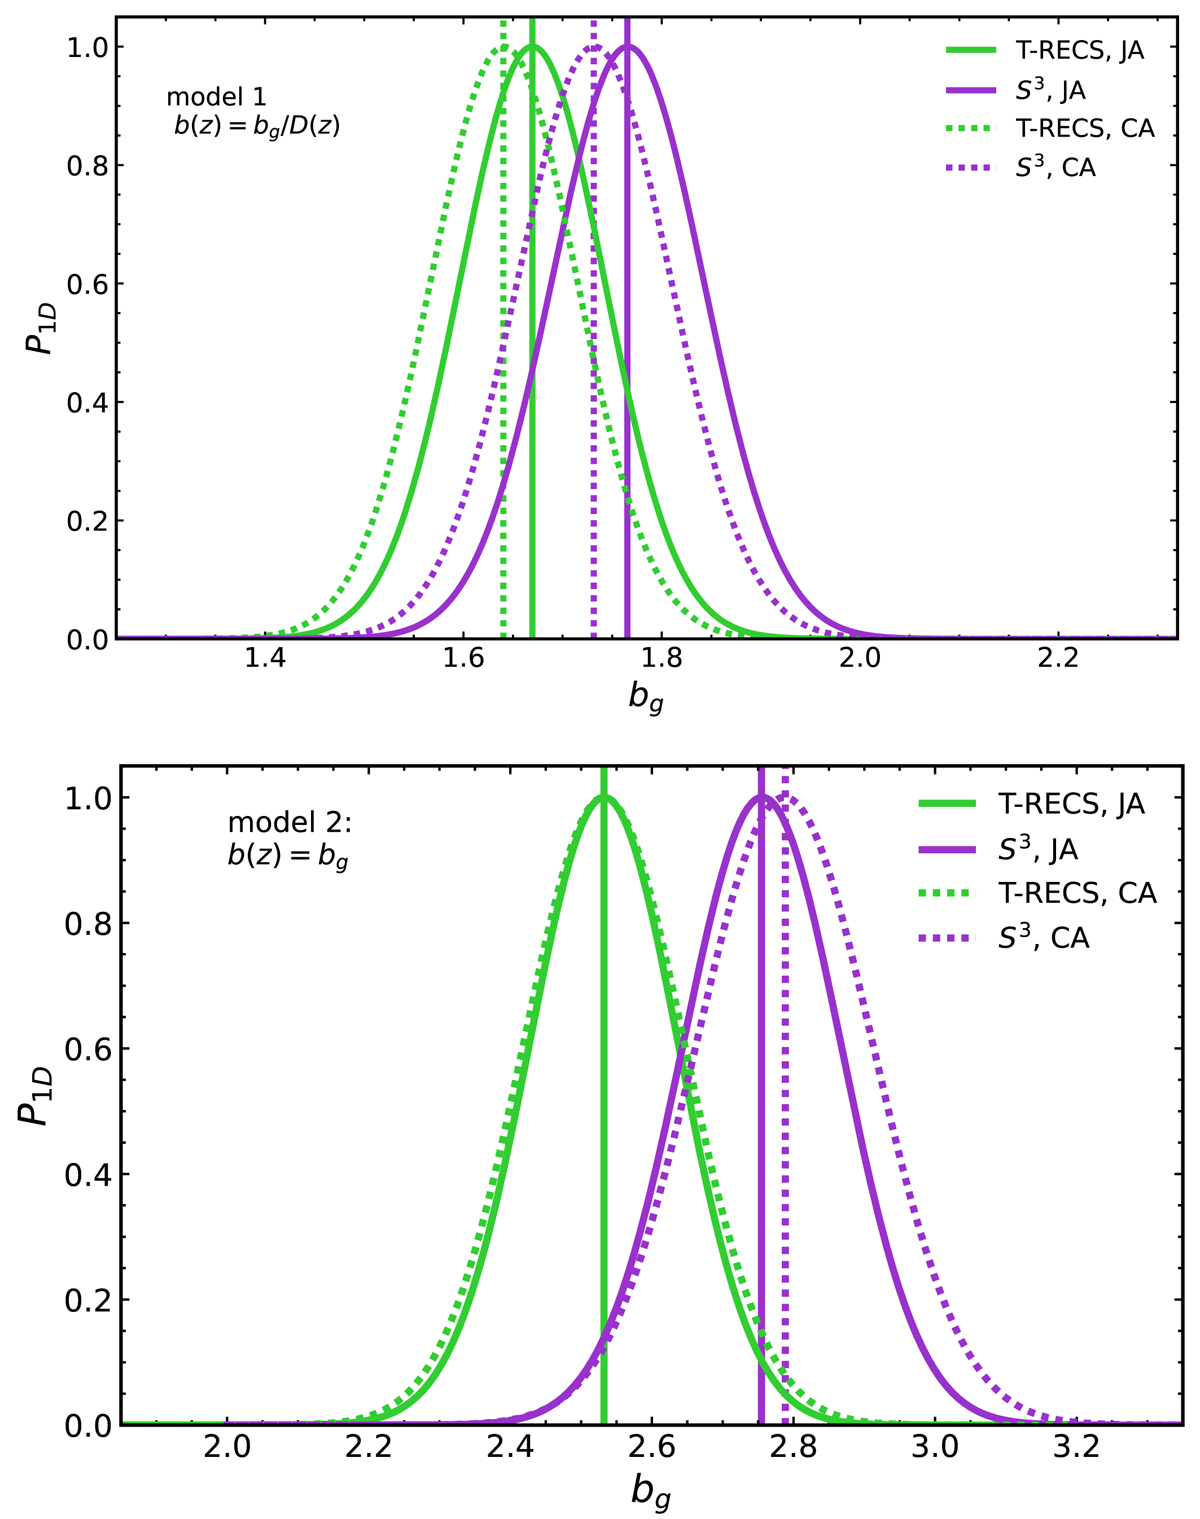
Fig. 10.
Download original image
Marginalized 1D probability distributions, P1D, of bg for different bias models. The continuous curves show P1D for model 1 (constant bias) and model 2 (linearly growing bias), obtained from the joint NVSS gg and κg power spectrum analysis. All curves are normalized so that P1D = 1 at the maximum. Different colors indicate the different N(z) models and match those used in Fig. 9. Dotted curves are drawn for comparison and show the P1D from the NVSS cross-spectrum-only analysis. They are labeled CA to further distinguish them from those obtained from the joint analysis, labeled JA.
Current usage metrics show cumulative count of Article Views (full-text article views including HTML views, PDF and ePub downloads, according to the available data) and Abstracts Views on Vision4Press platform.
Data correspond to usage on the plateform after 2015. The current usage metrics is available 48-96 hours after online publication and is updated daily on week days.
Initial download of the metrics may take a while.