Fig. 9
Download original image
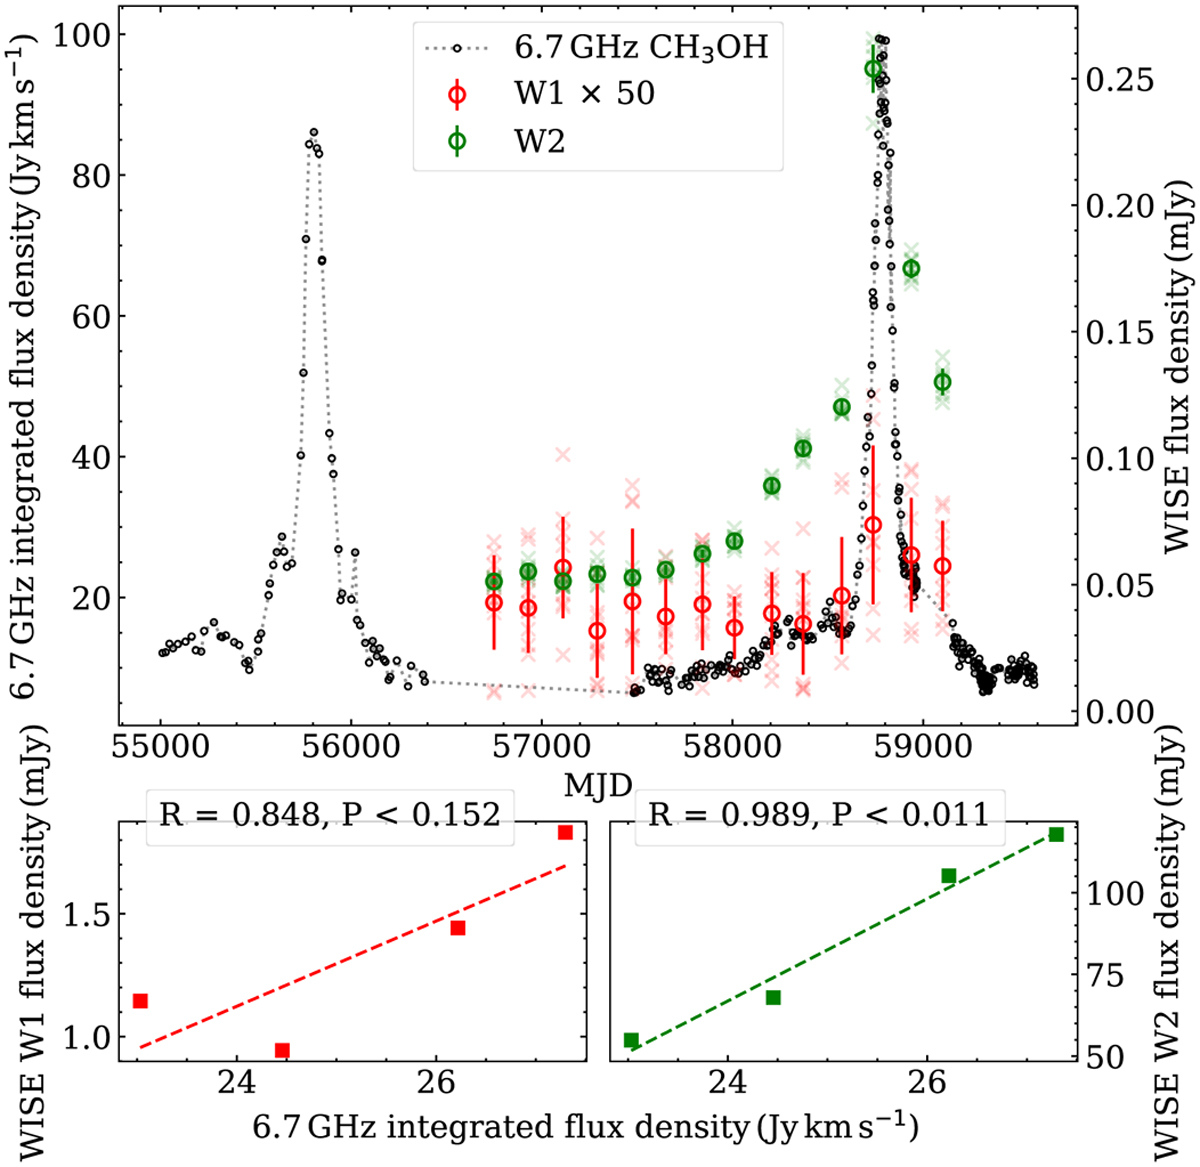
WISE W1 and W2 photometric measurements superimposed with 6.7 GHz CH3OH maser integrated flux density. Circles indicate the values of the WISE measurements for every epoch; transparent crosses indicate the singular WISE photometric measurements. The error bars correspond to standard deviation. Only measurements with cc_flags of 0 (unaffected by known artifacts) or h (possible contamination by scattered light from a nearby bright source), and qual_frame values no lower than 5 (high image quality) are shown. Two bottom panels show 6.7 GHz integrated flux density vs. WISE singular measurements. Here, a stricter quality criterion was also used: only ph_qual of A (source detected in this band with S/N > 10). Values in the boxes are Pearson correlation coefficients.
Current usage metrics show cumulative count of Article Views (full-text article views including HTML views, PDF and ePub downloads, according to the available data) and Abstracts Views on Vision4Press platform.
Data correspond to usage on the plateform after 2015. The current usage metrics is available 48-96 hours after online publication and is updated daily on week days.
Initial download of the metrics may take a while.