Fig. 8
Download original image
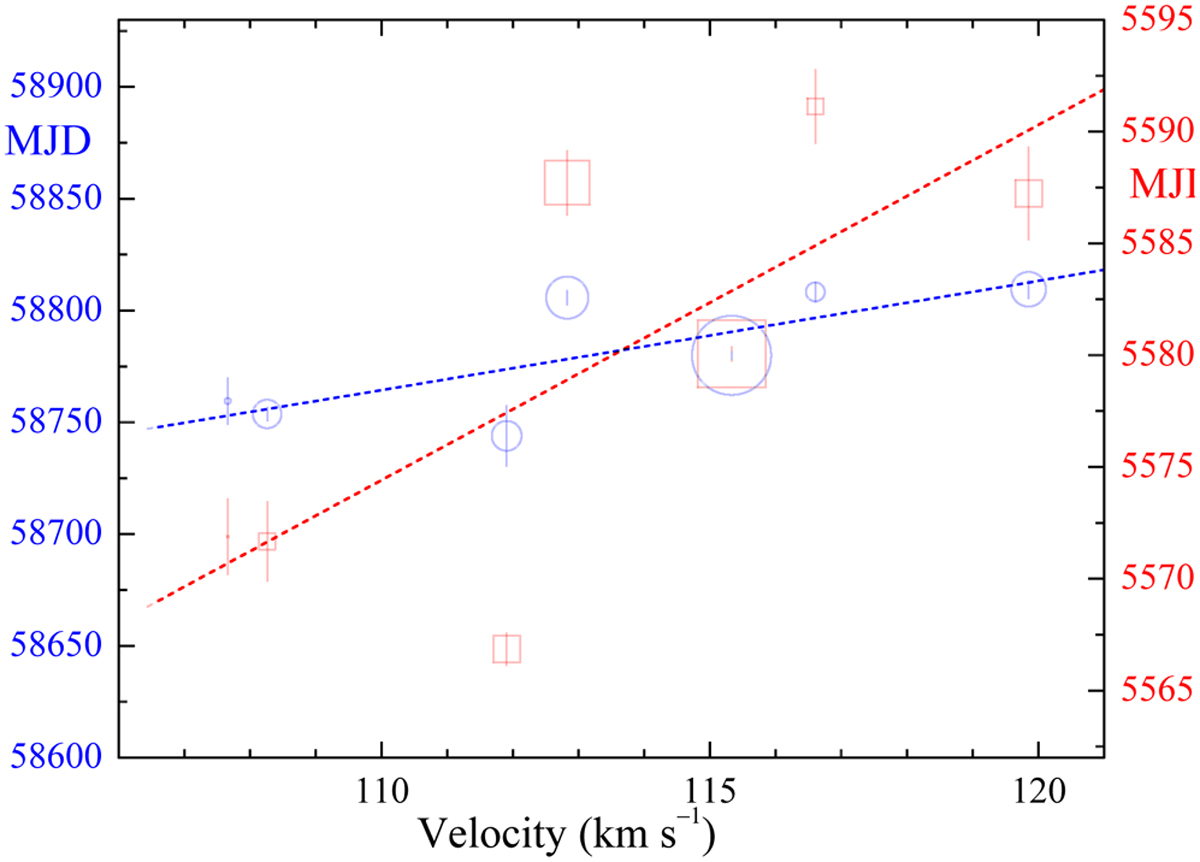
Dates of the flux density maxima of the maser spectral features at 6.7 GHz at the first (red) and second (blue) flare events in 2011 and 2019, respectively. The symbol sizes are proportional to the logarithm of the flux density and the vertical bars indicate the fivefold standard error of the peak flare time maxima. The dashed lines denote the best fits to the data.
Current usage metrics show cumulative count of Article Views (full-text article views including HTML views, PDF and ePub downloads, according to the available data) and Abstracts Views on Vision4Press platform.
Data correspond to usage on the plateform after 2015. The current usage metrics is available 48-96 hours after online publication and is updated daily on week days.
Initial download of the metrics may take a while.