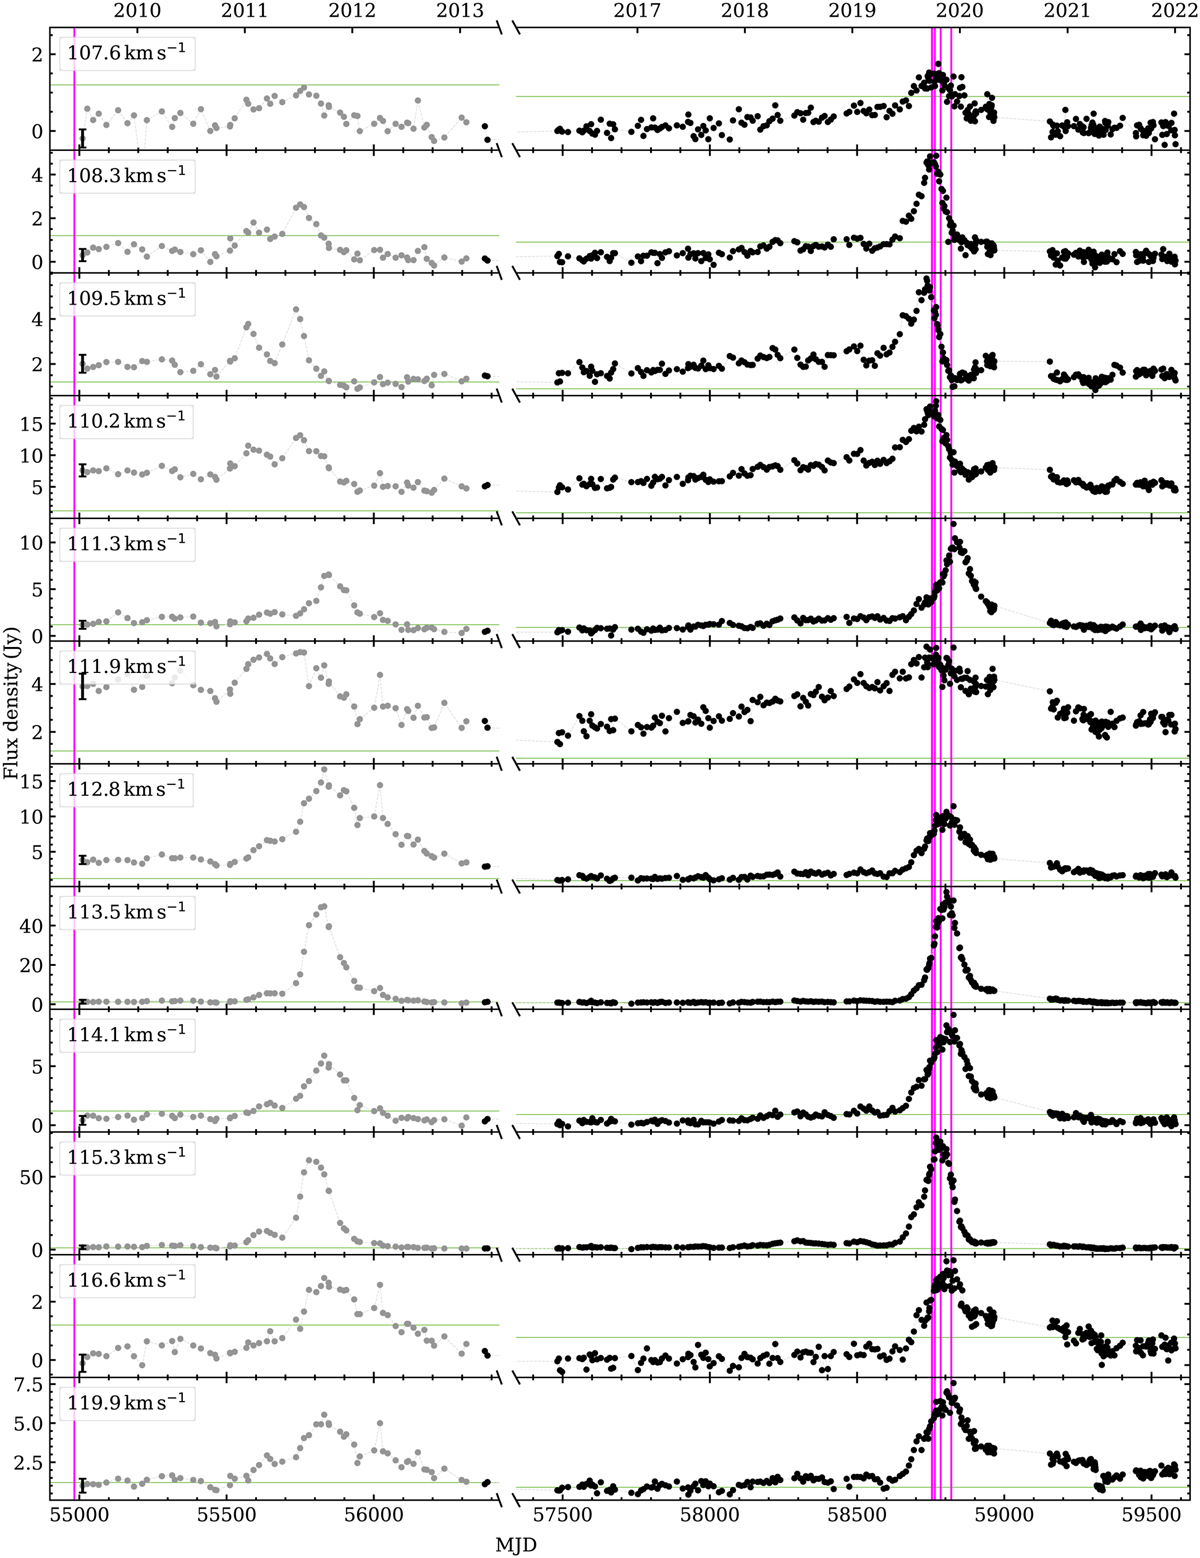
Fig. 6
Download original image
Light curves of the 6.7 GHz methanol maser features. The typical 3σ noise level is shown as the green horizontal line. The observational data from before March 2013 (gray dots) were published in Szymczak et al. (2018a). The typical measurement uncertainty is shown by the bar for the first data point of each curve. No observations were made in the period of 56387<MJD<57482. The vertical magenta lines indicate the epochs of the VLBI projects presented in this paper.
Current usage metrics show cumulative count of Article Views (full-text article views including HTML views, PDF and ePub downloads, according to the available data) and Abstracts Views on Vision4Press platform.
Data correspond to usage on the plateform after 2015. The current usage metrics is available 48-96 hours after online publication and is updated daily on week days.
Initial download of the metrics may take a while.