Fig. 3
Download original image
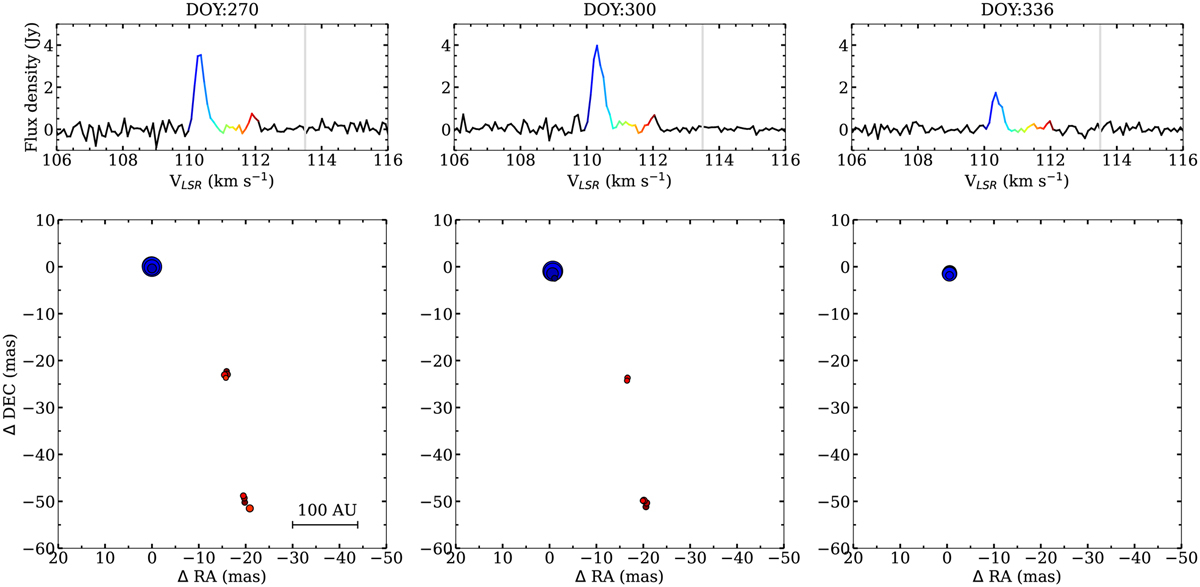
VLBA maps of the 12.2 GHz methanol maser spots in G24 at three epochs. The size of the circles is proportional to the square root of the intensity of a given spot. The symbol color corresponds to the LSR velocity as indicated in the inserted spectra. The vertical gray lines at the spectra indicate systemic velocity (Hirota et al. 2022). The point (0,0) corresponds to RA(J2000)= 18h35m08s.13433 and Dec(J2000) = −07°35′04.″2806, the position of the brightest spot at DOY: 270.
Current usage metrics show cumulative count of Article Views (full-text article views including HTML views, PDF and ePub downloads, according to the available data) and Abstracts Views on Vision4Press platform.
Data correspond to usage on the plateform after 2015. The current usage metrics is available 48-96 hours after online publication and is updated daily on week days.
Initial download of the metrics may take a while.