Fig. A.7
Download original image
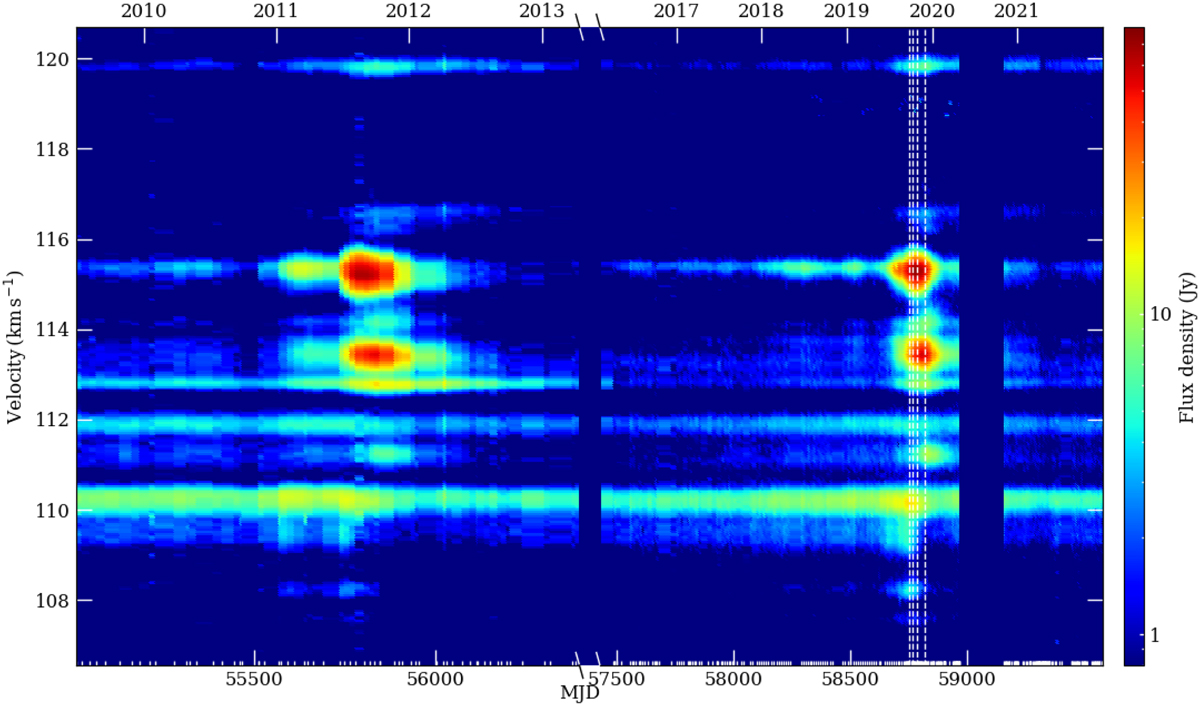
Dynamic spectrum of 6.7 GHz methanol maser emission of G24. The velocity is measured with respect to the local standard of rest. The vertical bars on the bottom ordinate correspond to the dates of the observed spectra. The white dashed vertical lines indicate the epochs of VLBI observations. There were no observations in the periods 56387<MJD<57482 and 58967<MJD<59153.
Current usage metrics show cumulative count of Article Views (full-text article views including HTML views, PDF and ePub downloads, according to the available data) and Abstracts Views on Vision4Press platform.
Data correspond to usage on the plateform after 2015. The current usage metrics is available 48-96 hours after online publication and is updated daily on week days.
Initial download of the metrics may take a while.