Fig. 14
Download original image
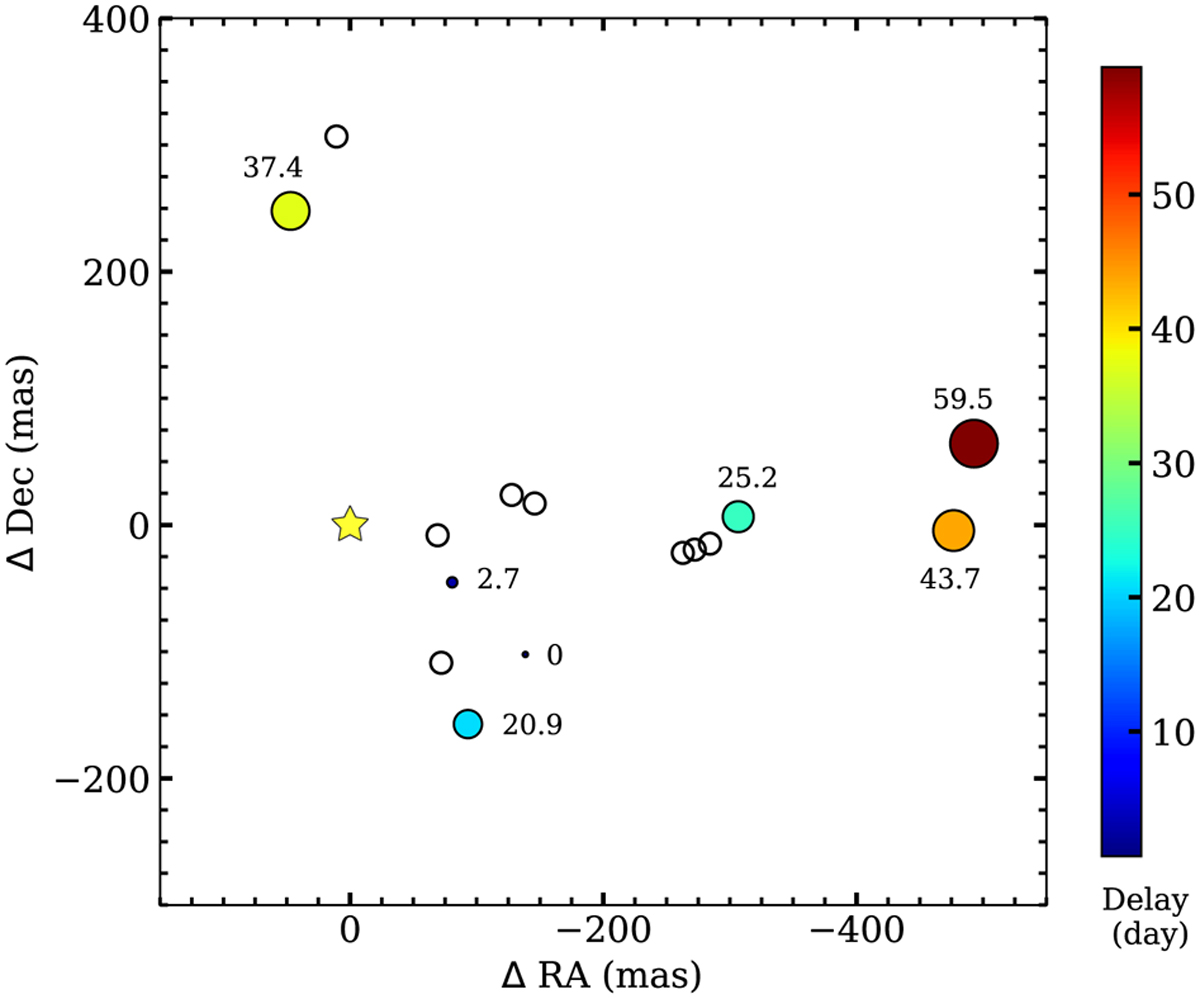
Map of the 6.7 GHz methanol maser cloudlets detected with VLBA at DOY: 270. The time lags as fitted to the 32 m telescope measurements (Fig. 8) are marked by color and circle size, as indicated in the wedge. The size of symbols is proportional to the square root of delay. Cloudlets without meaningful measurements are marked as open circles. The yellow star is as in Fig. 1.
Current usage metrics show cumulative count of Article Views (full-text article views including HTML views, PDF and ePub downloads, according to the available data) and Abstracts Views on Vision4Press platform.
Data correspond to usage on the plateform after 2015. The current usage metrics is available 48-96 hours after online publication and is updated daily on week days.
Initial download of the metrics may take a while.