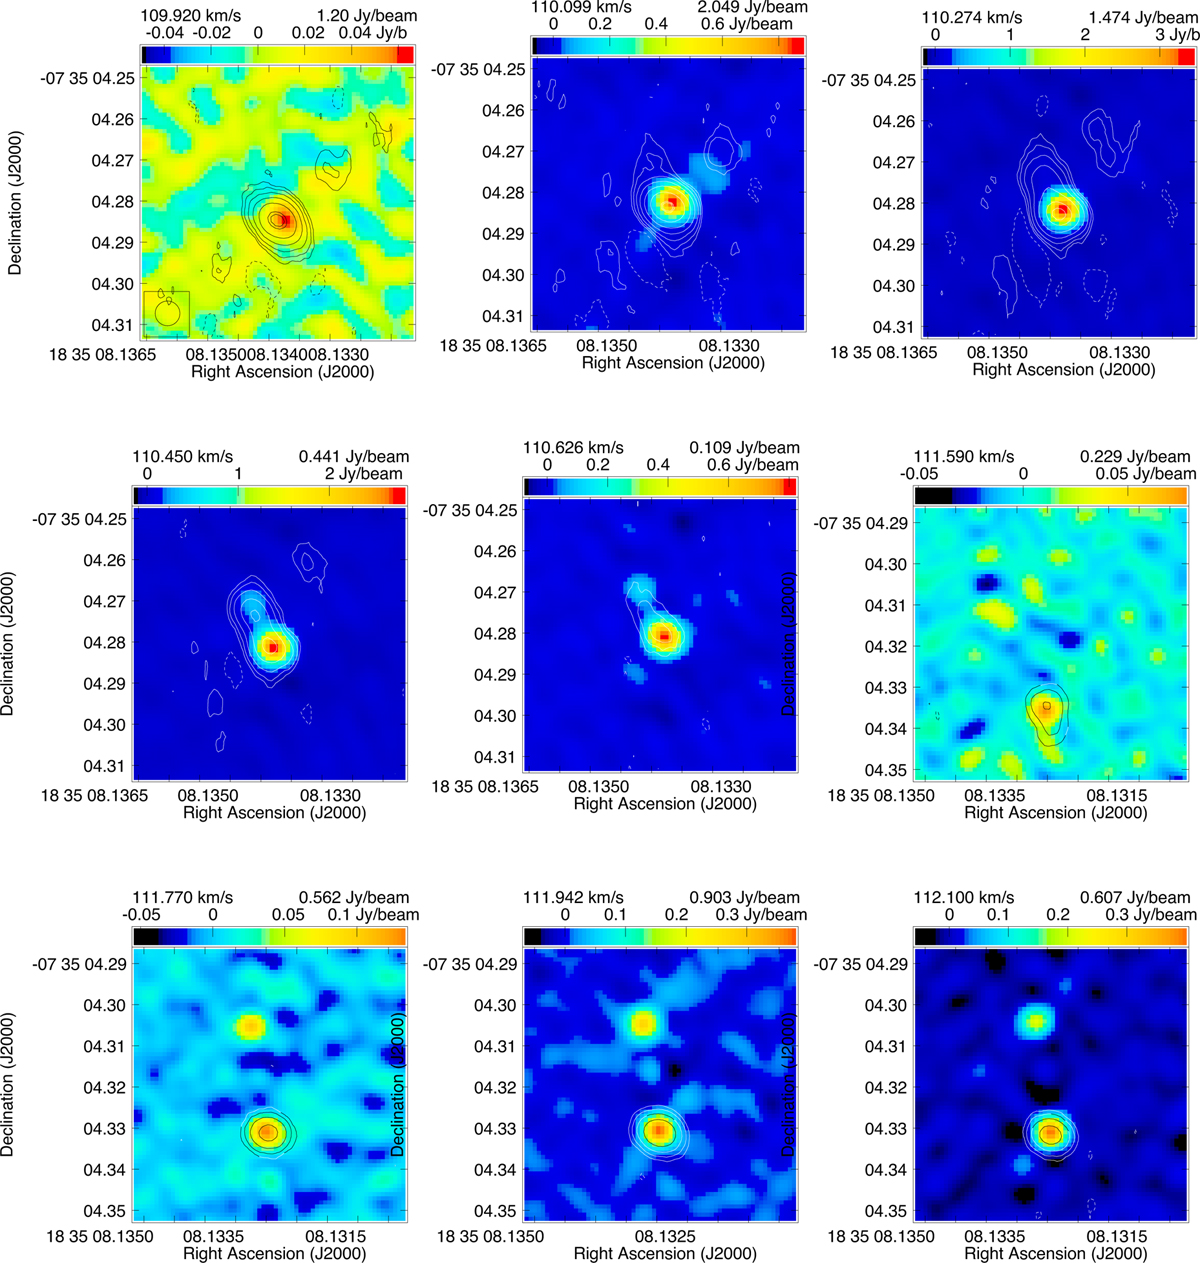
Fig. 12
Download original image
Channel images showing co-propagation of 6.7 and 12.2 GHz methanol masers obtained at DOY:300. The first five images at velocities of 109.92 to 110.63 km s−1 represent 6.7 GHz Cloudlet 12 and 12.2 GHz Cloudlet 3, while the next four images show Cloudlets 10 (6.7 GHz) and 1 (12.2 GHz) for the velocity range of 111.59–112.10 km s−1 (Tables A.1 and A.2). Contours represent the 6.7 GHz methanol maser emission; the first contour corresponds to 30 mJy beam−1 (~ 3σrnns). The next contours are at 2, 4, 8, 16, 32, 64, and 128 times 3σrms. The first negative contour is also shown, and the contour at the 90% of the peak emission. The numbers at the top of each panel correspond to the LSR velocities of each spectral channel and the peak intensity of the 6.7 GHz methanol maser emission. The color scale presents the 12.2 GHz methanol emission with ranges as indicated at the top of each map in Jy beam−1.
Current usage metrics show cumulative count of Article Views (full-text article views including HTML views, PDF and ePub downloads, according to the available data) and Abstracts Views on Vision4Press platform.
Data correspond to usage on the plateform after 2015. The current usage metrics is available 48-96 hours after online publication and is updated daily on week days.
Initial download of the metrics may take a while.