Fig. 11
Download original image
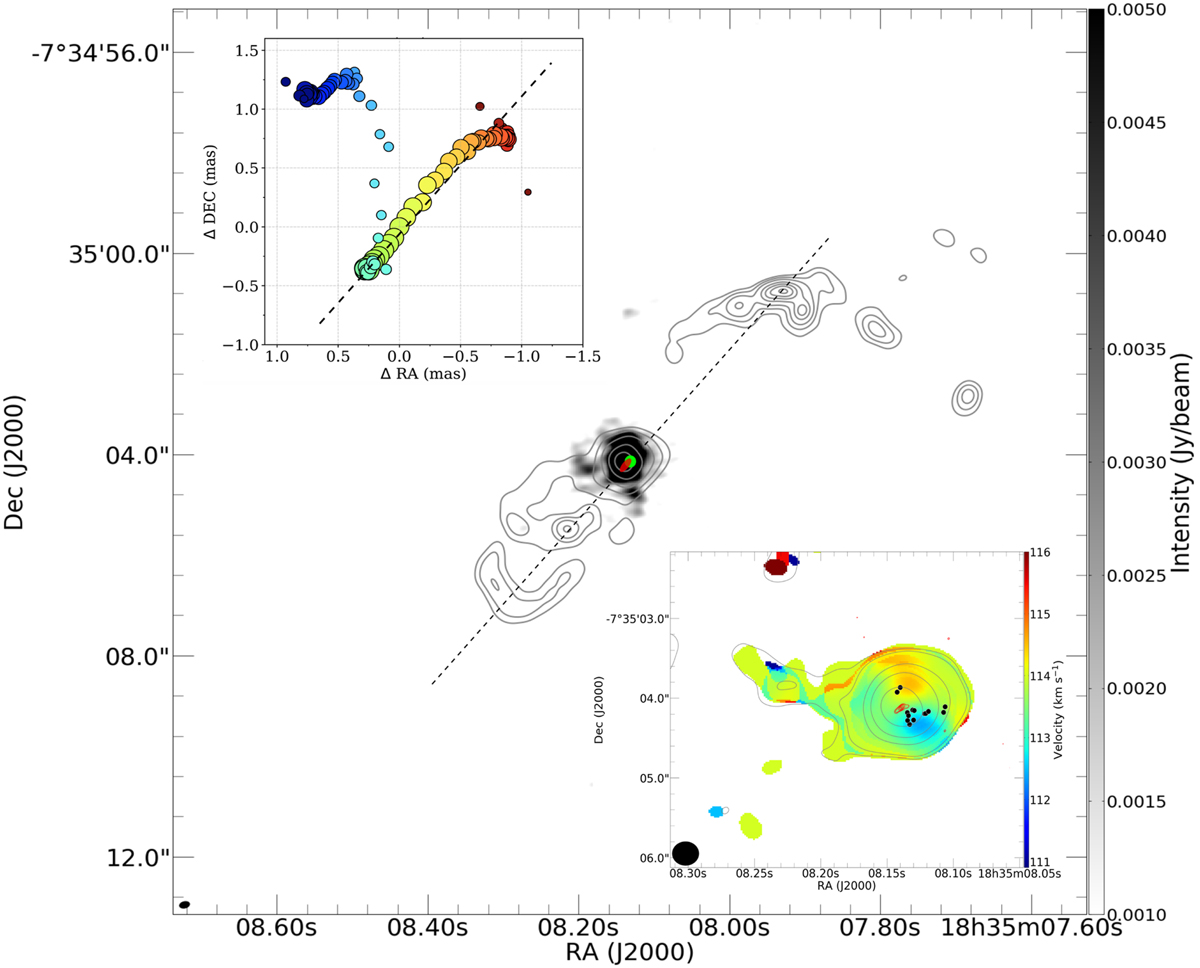
Aligned large-scale and compact bipolar outflow. The grayscale background represents ALMA 1.3 mm dust continuum emission of G24, while the gray contours (levels: [0.2, 0.5, 1, 2, 3, 4, 5, 6] Jy beam−1 km s−1 ) represent the moment 0 (integrated intensity) map of the 229.758 GHz class I CH3OH maser line. The red ellipse (same as red contours in the bottom right inset) indicates the position of the 7 mm (Q-band) ionized jet reported in Purser et al. (2021) and elongated along the axis of the ALMA CH3OH line and the VLBA 22.2 GHz water maser linear structure (top left inset). The green filled circle represents the position of the water masers in G24. The top left inset is the VLBA DOY: 336 epoch of the water maser (see Fig. 4). The dashed lines show the axes of the large-scale (in the ALMA image) and compact (in the VLBA water maser map) outflows driven by G24. The position angle derived from the ALMA millimeter data is ~136°. The bottom right inset shows the ALMA moment 1 map of the 229.589 GHz CH3OH line with its moment 0 maps overlaid as contours (levels: [0.04, 0.08, 0.5, 1, 2] Jy beam−1 km s−1 ). The VLBI DOY: 270 positions of the 6.7 GHz methanol masers are represented by the black filled circles.
Current usage metrics show cumulative count of Article Views (full-text article views including HTML views, PDF and ePub downloads, according to the available data) and Abstracts Views on Vision4Press platform.
Data correspond to usage on the plateform after 2015. The current usage metrics is available 48-96 hours after online publication and is updated daily on week days.
Initial download of the metrics may take a while.