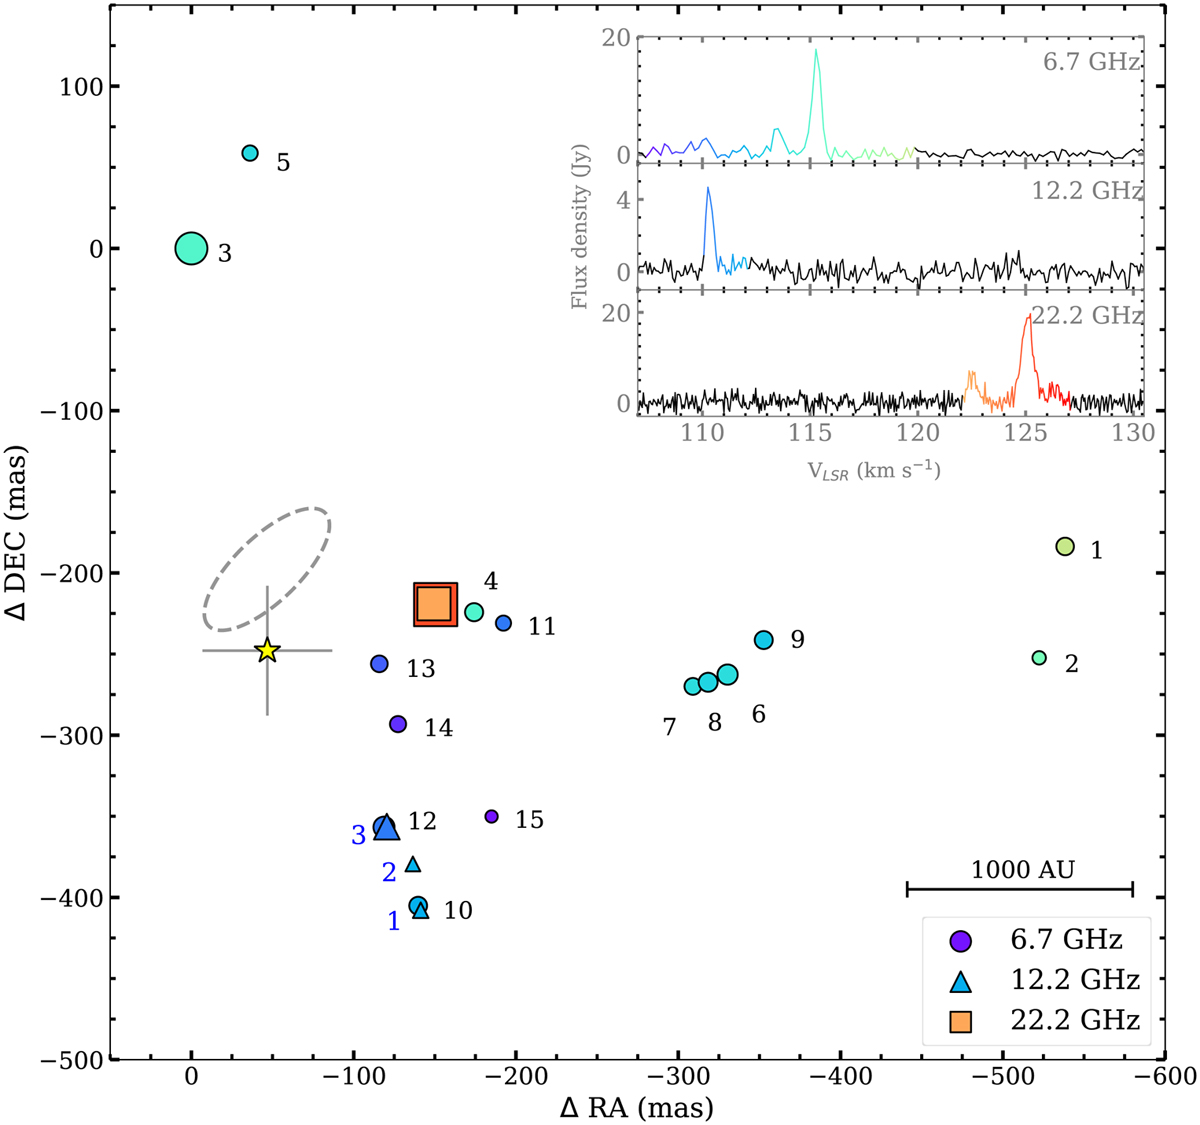
Fig. 1
Download original image
Distribution of methanol and water maser cloudlets in G24 obtained with VLBA at DOY: 270. The inset shows the corresponding spectra. The circles, triangles, and squares correspond to the 6.7 GHz, 12.2 GHz methanol, and 22.2 GHz water transitions, respectively. The symbol sizes are proportional to the square root of the maser intensities. The symbol color corresponds to the LSR velocity, as indicated in the inserted spectra. The black numbers refer to groups of the 6.7 GHz methanol maser spots identified as cloudlets (Table A.1), while the blue numbers to the 12.2 GHz methanol maser cloudlets (Table A.2). The yellow star represents the brightest 230 GHz continuum source at the position of RA(J2000) = 18h35m08s. 13928 and Dec(J2000) = −07°35′04.″1721, while the gray cross gives its astrometric uncertainty (Hirota et al. 2022). The (0,0) point corresponds to RA(J2000) = 18h35m08.14243 and Dec(J2000) = -07°35′03.″9242, which is the position of the brightness maser spot at 6.7 GHz at DOY: 270. The gray dotted ellipse indicates the position of the Q-band jet reported in Purser et al. (2021).
Current usage metrics show cumulative count of Article Views (full-text article views including HTML views, PDF and ePub downloads, according to the available data) and Abstracts Views on Vision4Press platform.
Data correspond to usage on the plateform after 2015. The current usage metrics is available 48-96 hours after online publication and is updated daily on week days.
Initial download of the metrics may take a while.