Fig. 9
Download original image
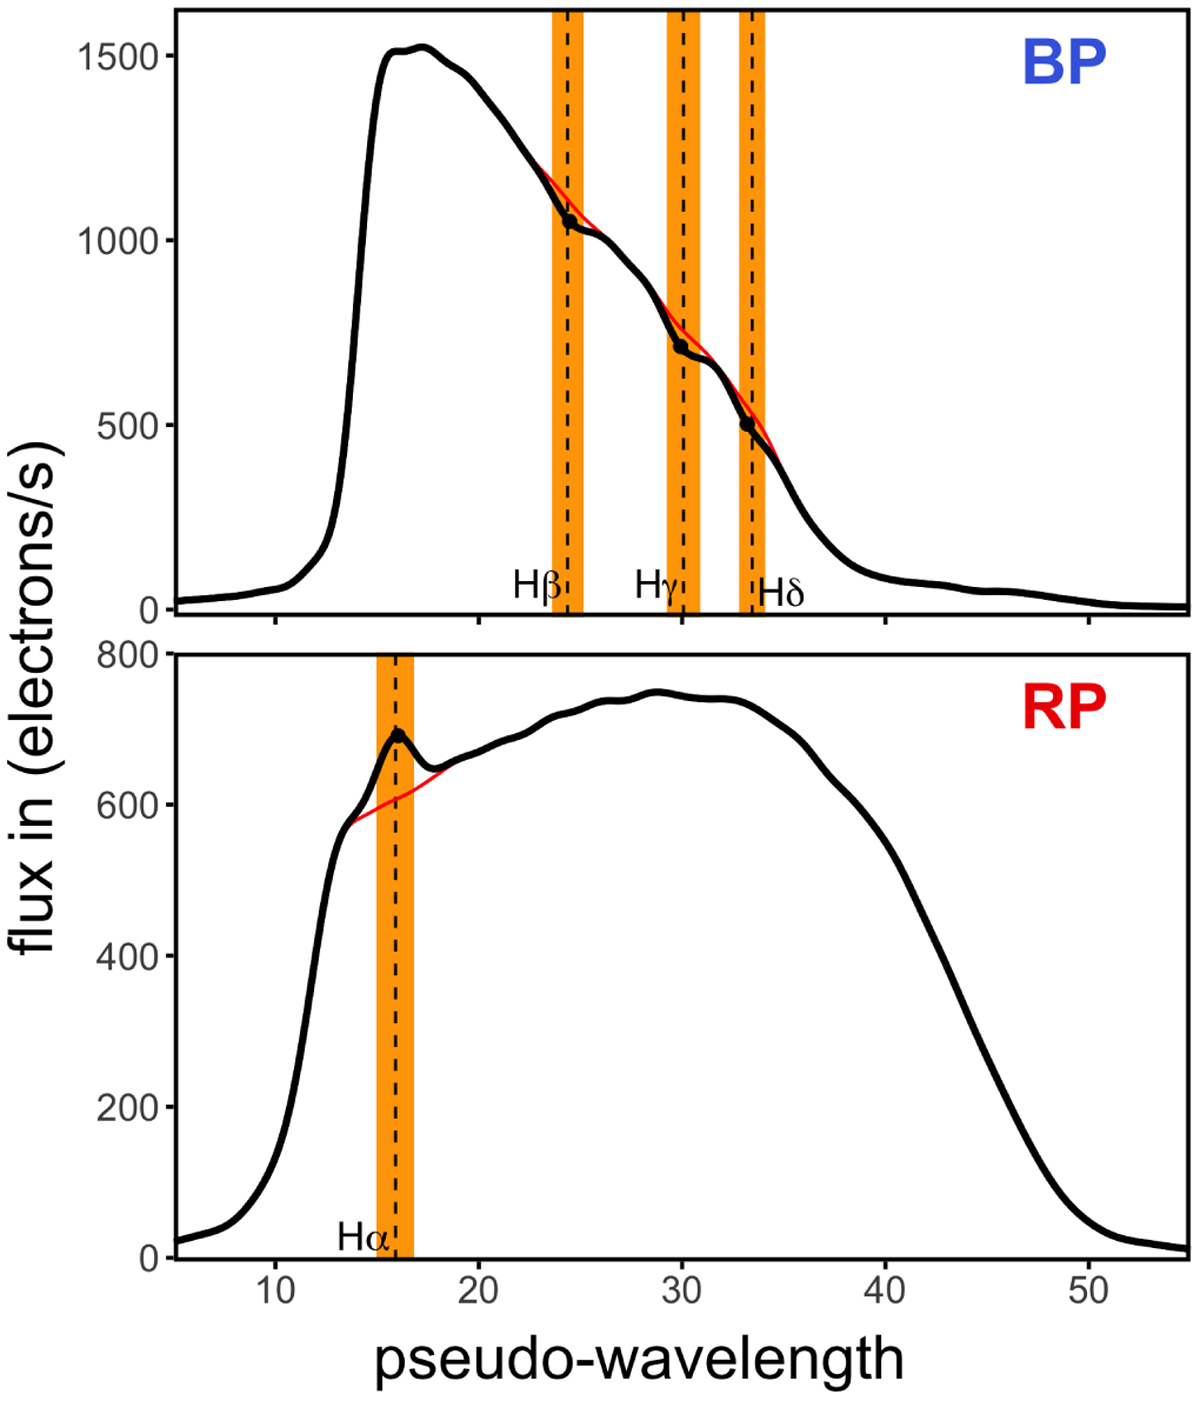
Example for the analysis of Hβ to Hδ in BP (top panel) and Ha in RP (bottom panel) for source Gaia DR3 505171240162594560. The nominal line positions are indicated by dashed lines, the shaded regions indicate the range in pseudo-wavelength within which a local extremum is considered in agreement with being a hydrogen Balmer line. For BP, the wavelength increase from right to left (with decreasing pseudo-wavelength) for RP from left to right (with increasing pseudo-wavelength). Black curves show the XP spectra, the red curves show the continuum model. Black dots indicate the positions of local extrema in the second derivative (Hβ to Hδ) and zero derivative (Hα).
Current usage metrics show cumulative count of Article Views (full-text article views including HTML views, PDF and ePub downloads, according to the available data) and Abstracts Views on Vision4Press platform.
Data correspond to usage on the plateform after 2015. The current usage metrics is available 48-96 hours after online publication and is updated daily on week days.
Initial download of the metrics may take a while.