Fig. 5
Download original image
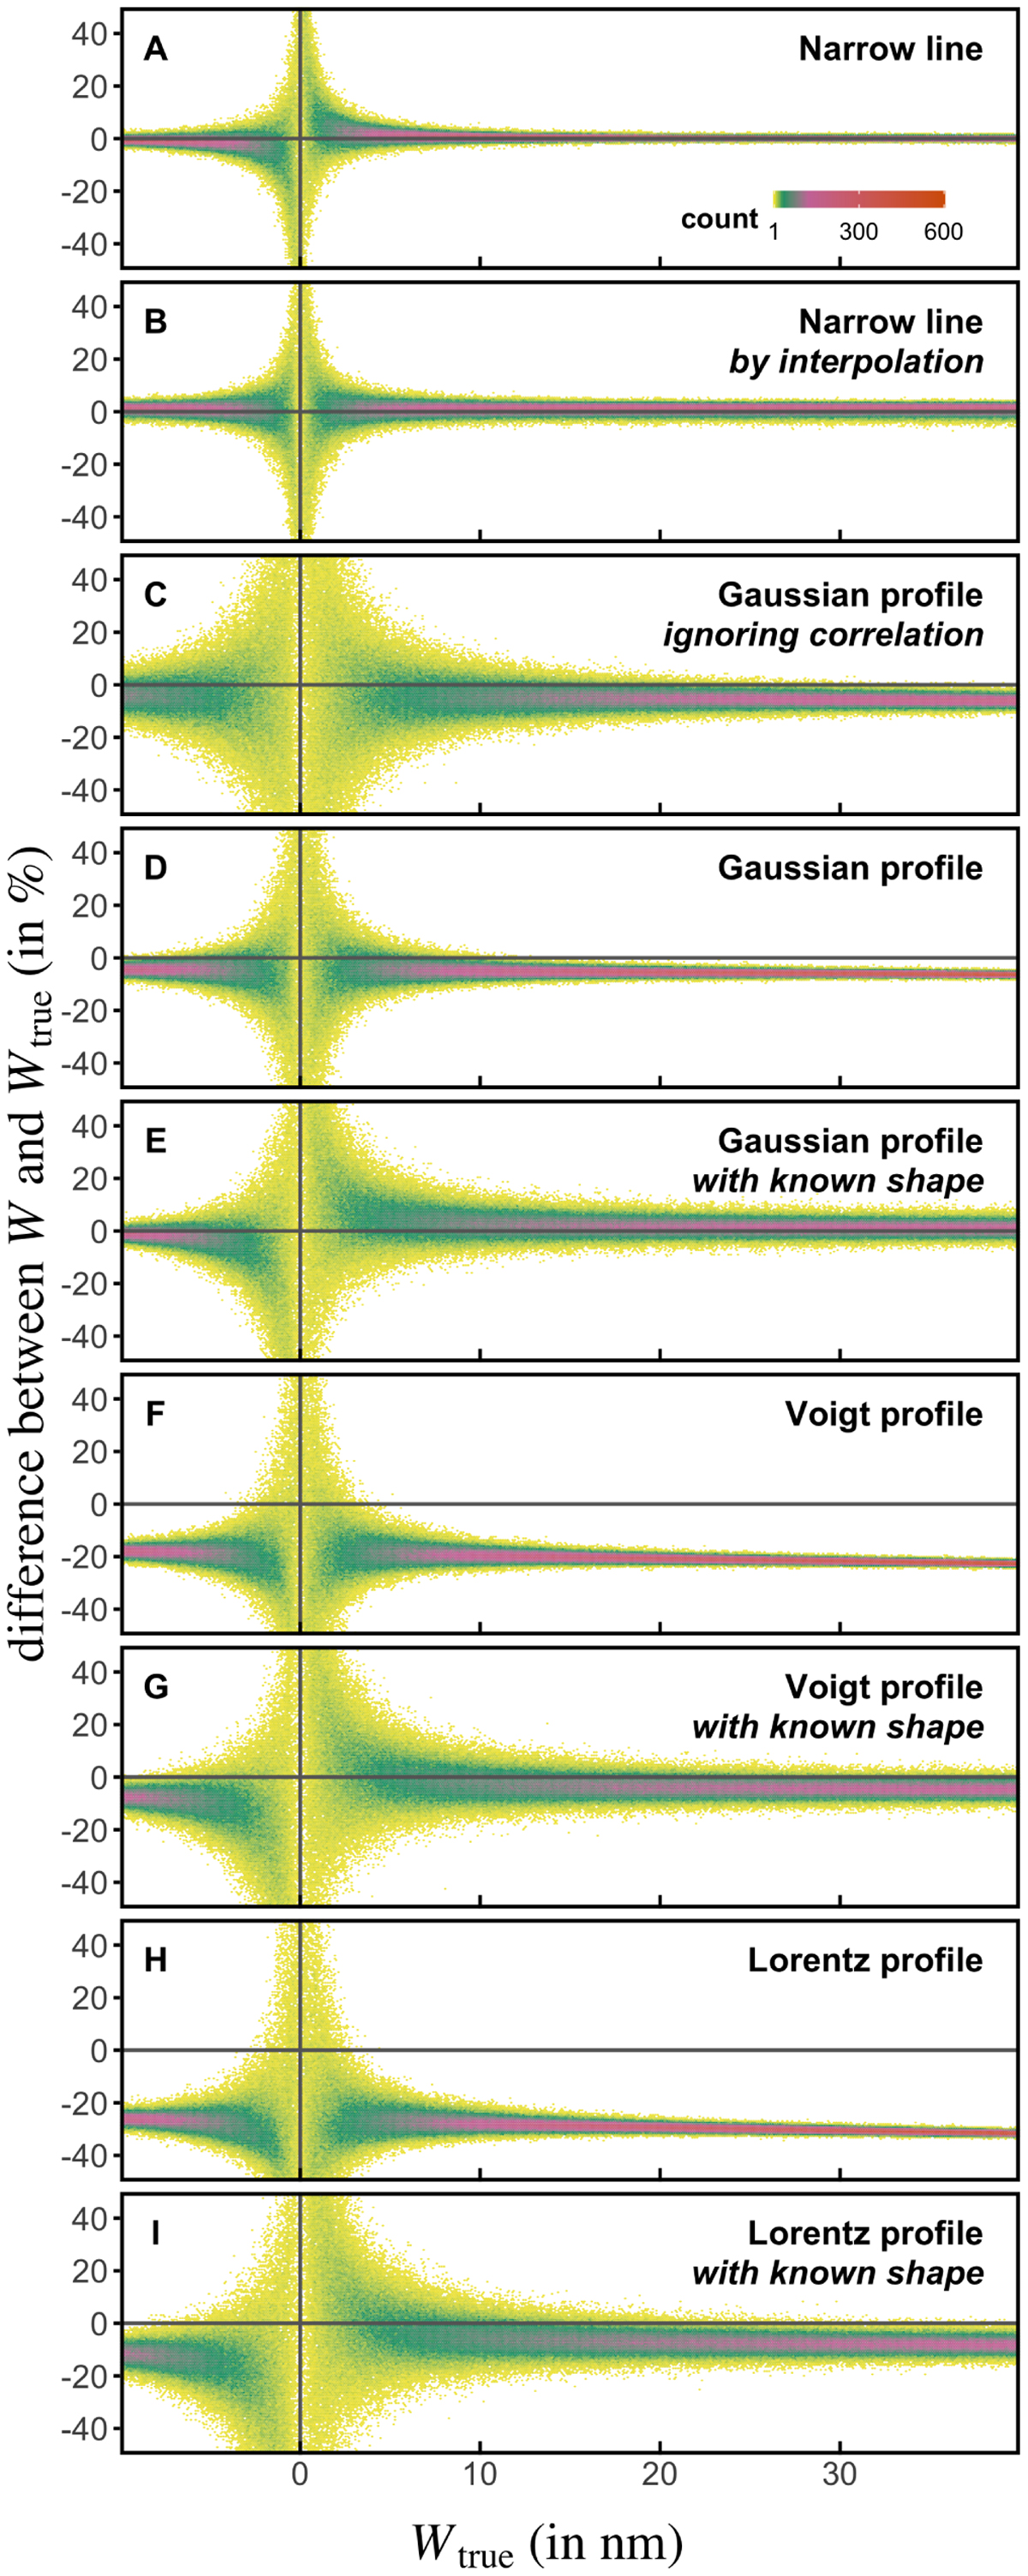
Distributions of the relative difference between the computed equivalent width (W) and the true equivalent width (Wtrue) of Hβ lines with a 2 × 10⁴ K black body continuum for different assumptions on the line shape (narrow lines, Gaussian, Voigt, and Lorentz profiles) and different computation techniques. Each panel shows the result from 5 × 10⁵ random realisations of a spectrum for G = 12m and ten transits. Positive values in the horizontal axis correspond to Hβ emission, negative values to Hβ absorption. For details see text in Sects. 8.3, 9.3, and 9.4.
Current usage metrics show cumulative count of Article Views (full-text article views including HTML views, PDF and ePub downloads, according to the available data) and Abstracts Views on Vision4Press platform.
Data correspond to usage on the plateform after 2015. The current usage metrics is available 48-96 hours after online publication and is updated daily on week days.
Initial download of the metrics may take a while.