Fig. 13
Download original image
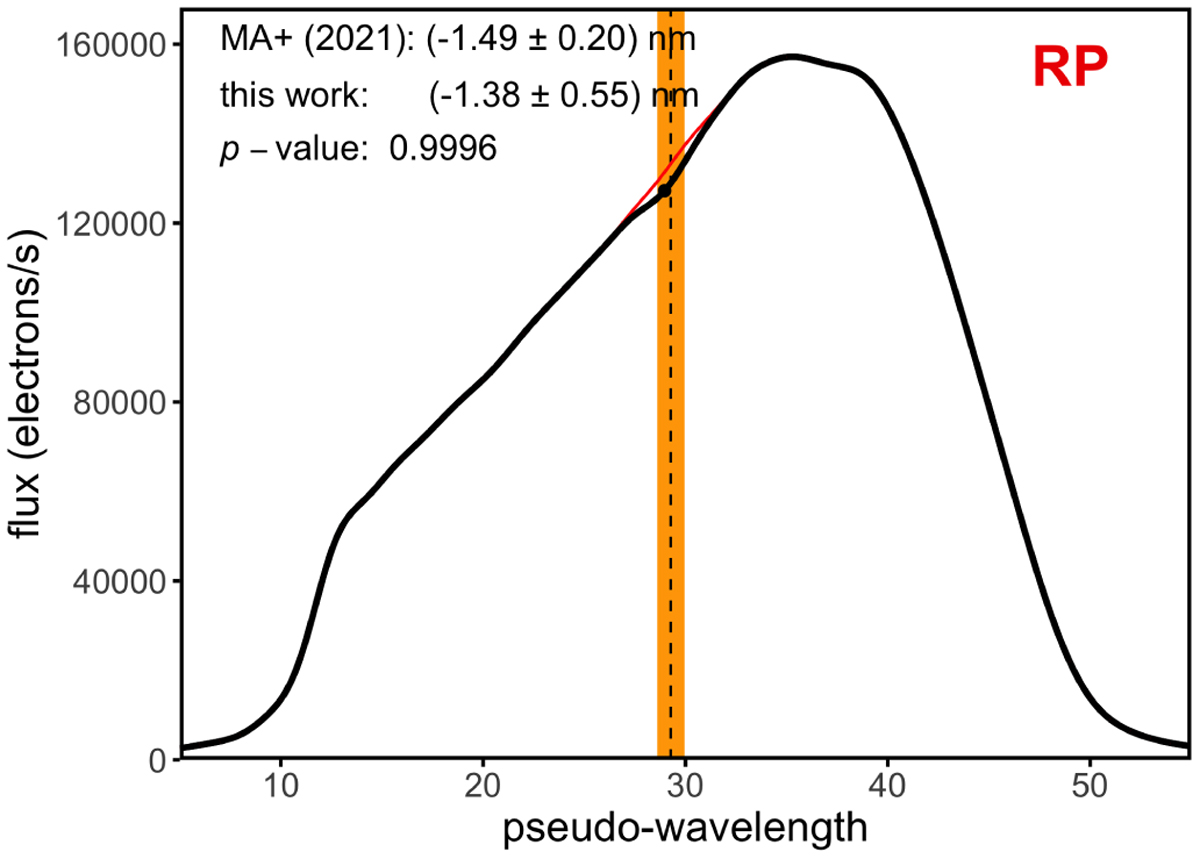
Example for the analysis of the broad interstellar band at 770 nm for source Gaia DR3 2067888218857234304. The nominal band position is indicated by dashed lines, the shaded regions indicate the range in pseudo-wavelength within which a local extremum is considered to be in agreement with the status of the band. The black curve shows the XP spectra and the red curve shows the continuum model. The black dot indicates the positions of local extrema in the second derivative.
Current usage metrics show cumulative count of Article Views (full-text article views including HTML views, PDF and ePub downloads, according to the available data) and Abstracts Views on Vision4Press platform.
Data correspond to usage on the plateform after 2015. The current usage metrics is available 48-96 hours after online publication and is updated daily on week days.
Initial download of the metrics may take a while.