Open Access
Fig. 12
Download original image
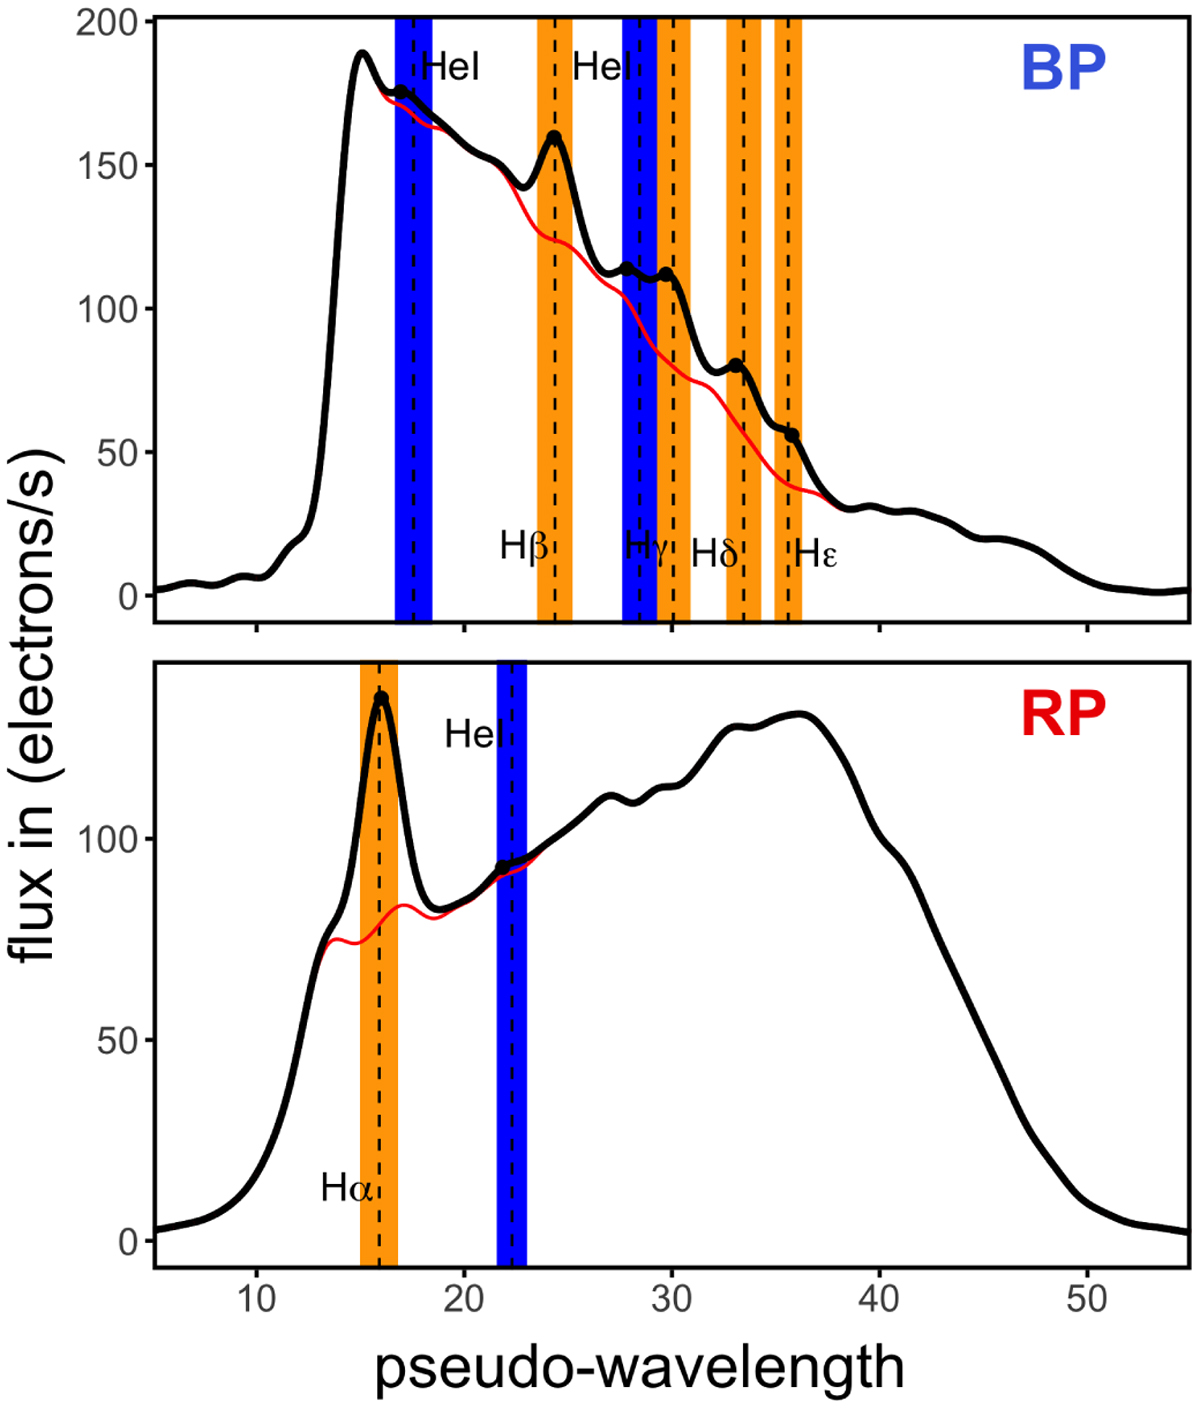
Analysis of hydrogen Balmer and He I lines for Gaia DR3 426306363477869696. As in Fig. 9, the wavelengths increase from right to left for BP (upper panel) and from left to right for RP (bottom panel).
Current usage metrics show cumulative count of Article Views (full-text article views including HTML views, PDF and ePub downloads, according to the available data) and Abstracts Views on Vision4Press platform.
Data correspond to usage on the plateform after 2015. The current usage metrics is available 48-96 hours after online publication and is updated daily on week days.
Initial download of the metrics may take a while.