Fig. 1
Download original image
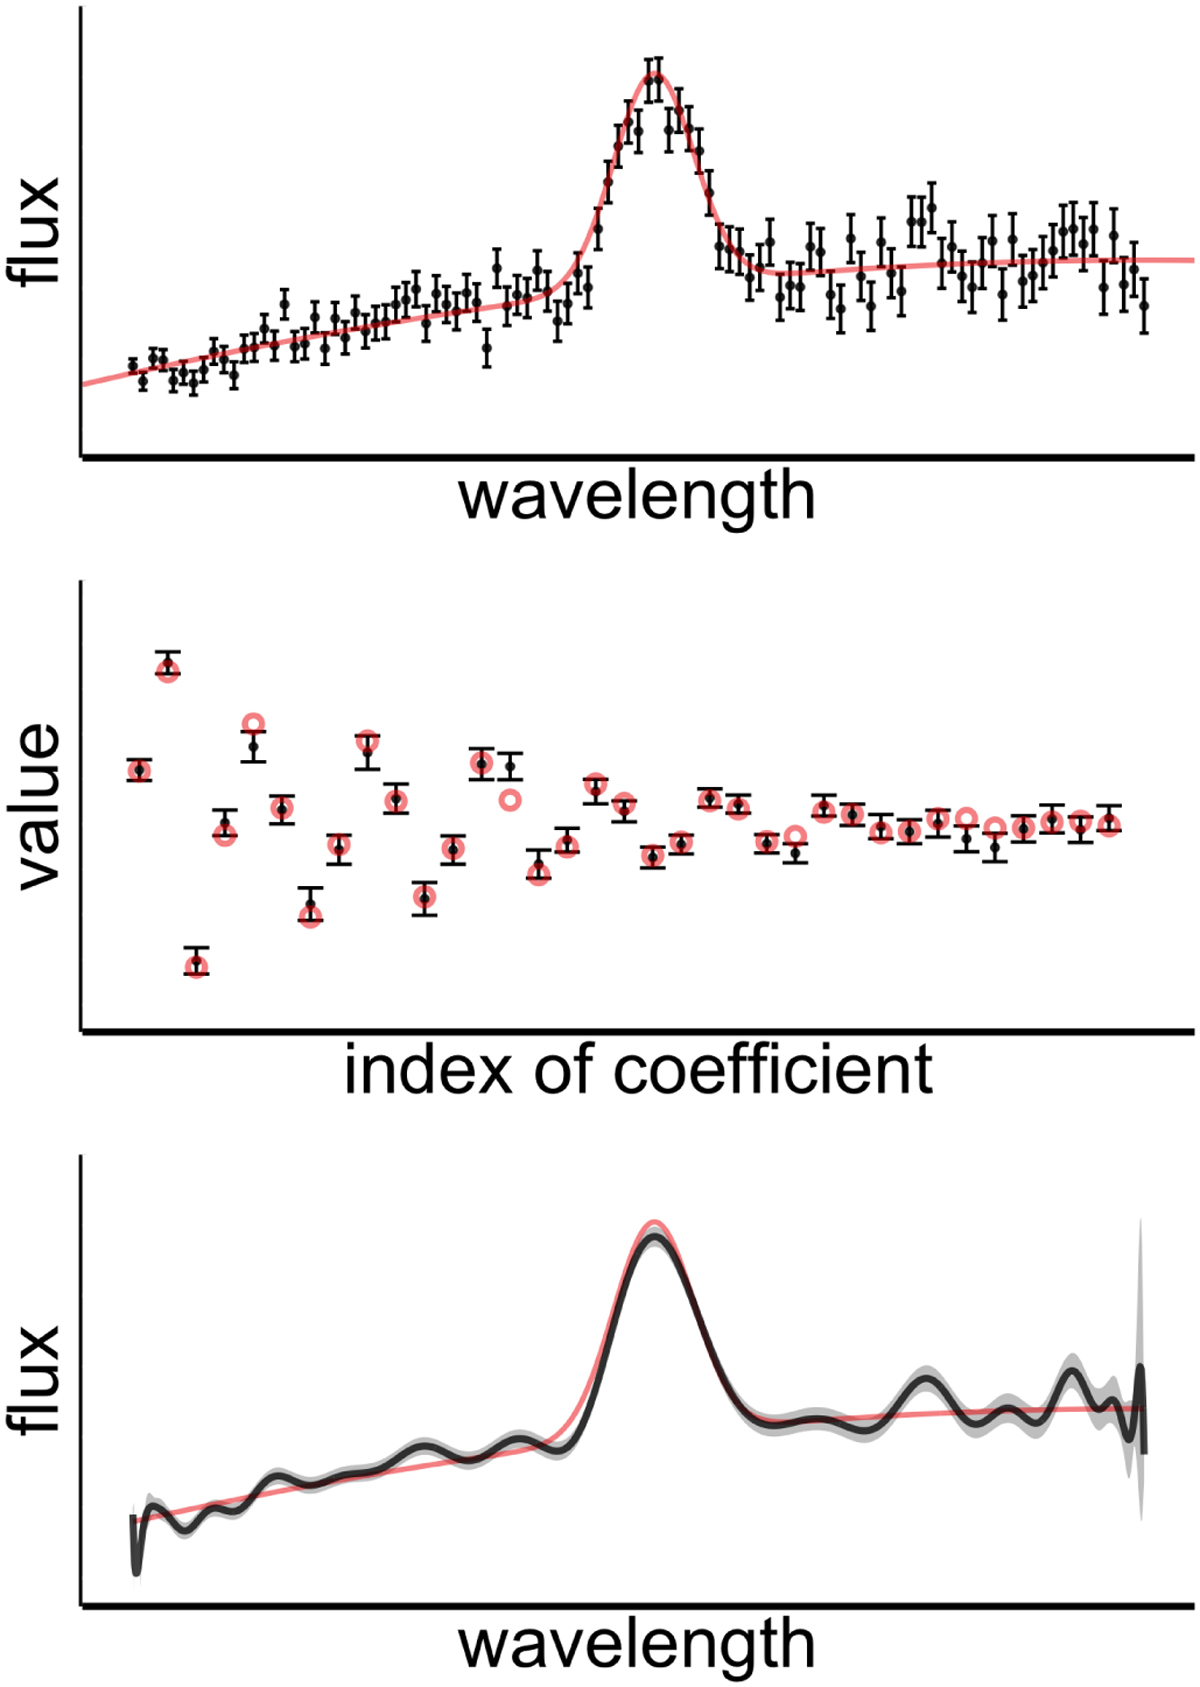
Sketch illustrating the difference between a typical spectrum and a spectrum represented by a linear combination of basis functions. Top panel: typical spectrum, consisting of sampled flux values on a wavelength grid (black symbols) derived from the spectral photon distribution (red line). Central panel: coefficients representing the same data set by a linear combination of basis functions. Black symbols show the noisy representation, red dots the true coefficients. Bottom panel: linear combination of basis functions (black line) and the 1-σ error interval (grey shaded region) as a function of wavelength.
Current usage metrics show cumulative count of Article Views (full-text article views including HTML views, PDF and ePub downloads, according to the available data) and Abstracts Views on Vision4Press platform.
Data correspond to usage on the plateform after 2015. The current usage metrics is available 48-96 hours after online publication and is updated daily on week days.
Initial download of the metrics may take a while.