Fig. 9
Download original image
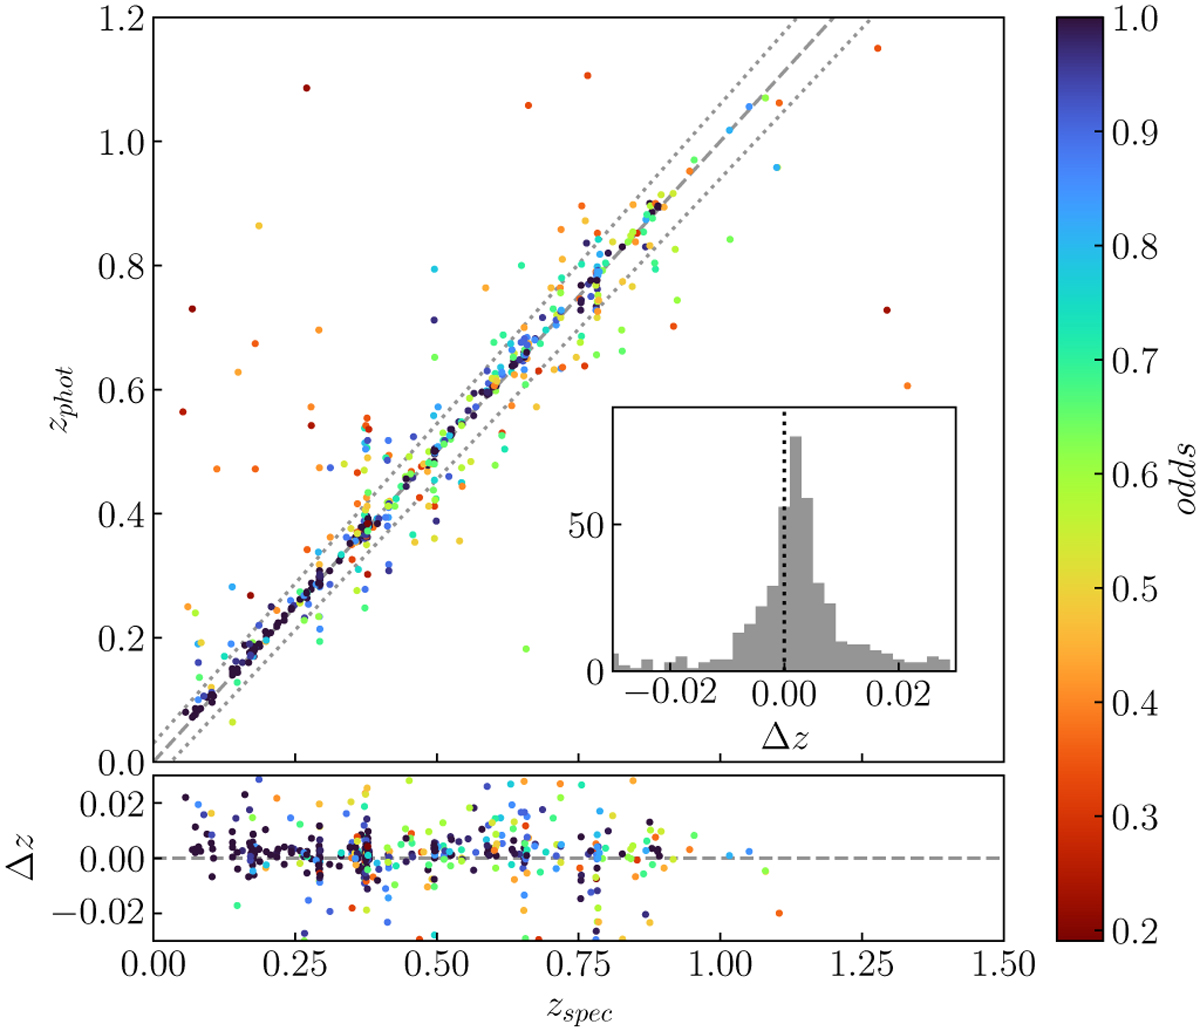
Photometric redshift (top panel) and photo-z error (bottom panel) versus spectroscopic redshift for individual sources in J-NEP. Only r < 23 sources with no photometry flags (FLAGS = 0 and MASK_FLAGS = 0) and reliable zspec are shown. The colour coding indicates the odds parameter that represents the confidence in the zphot solution. The dashed line indicates the zphot = zspec relation. Dotted lines in the top panel enclose the region corresponding to |Δz| < 0.03, which is enlarged in the bottom panel. The inset plot shows the distribution of Δz.
Current usage metrics show cumulative count of Article Views (full-text article views including HTML views, PDF and ePub downloads, according to the available data) and Abstracts Views on Vision4Press platform.
Data correspond to usage on the plateform after 2015. The current usage metrics is available 48-96 hours after online publication and is updated daily on week days.
Initial download of the metrics may take a while.