Fig. 7.
Download original image
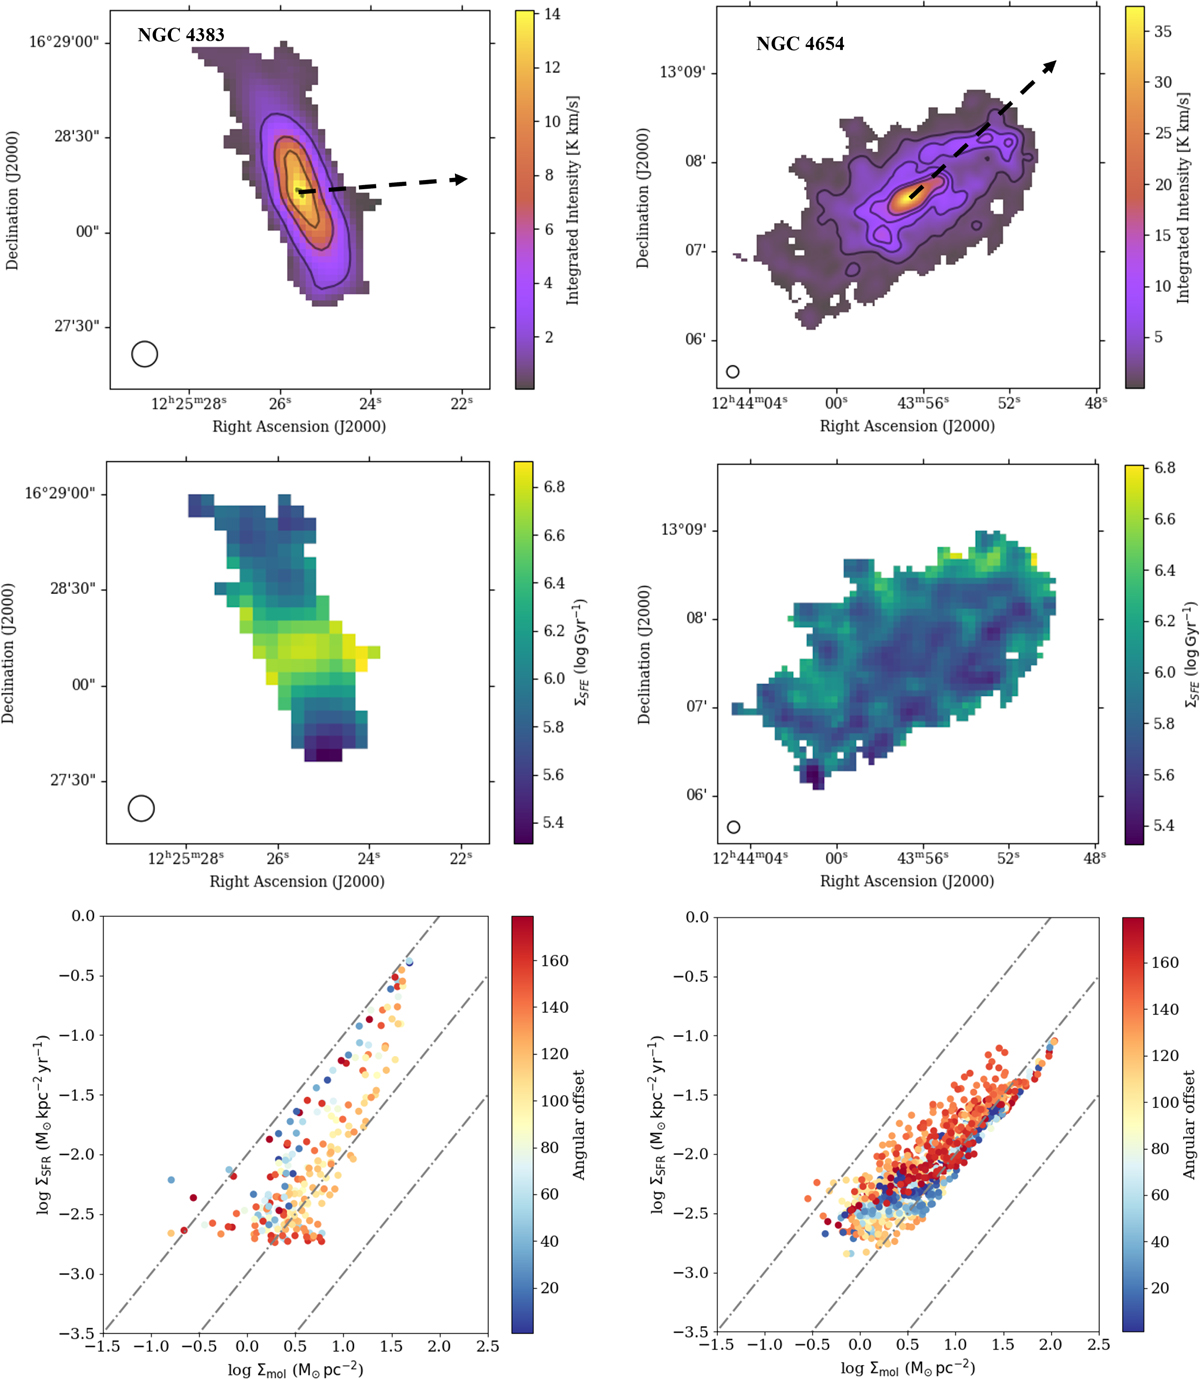
Systematic azimuthal variation of SFE. Top: integrated intensity map of CO (2–1) emission for NGC 4383 (left panel) and NGC 4654 (right panel). The black dashed arrow represents the direction where the largest azimuthal variations of SFE are found. Angular offsets are measured from this direction to each different line-of-sight. Middle: Map of resolved star formation efficiency of molecular gas, calculated as shown in Eq. (4). Bottom: Resolved Kennicutt-Schmidt relations, color coded by the angular separation from the preferential direction shown on the integrated intensity map.
Current usage metrics show cumulative count of Article Views (full-text article views including HTML views, PDF and ePub downloads, according to the available data) and Abstracts Views on Vision4Press platform.
Data correspond to usage on the plateform after 2015. The current usage metrics is available 48-96 hours after online publication and is updated daily on week days.
Initial download of the metrics may take a while.