Fig. 6.
Download original image
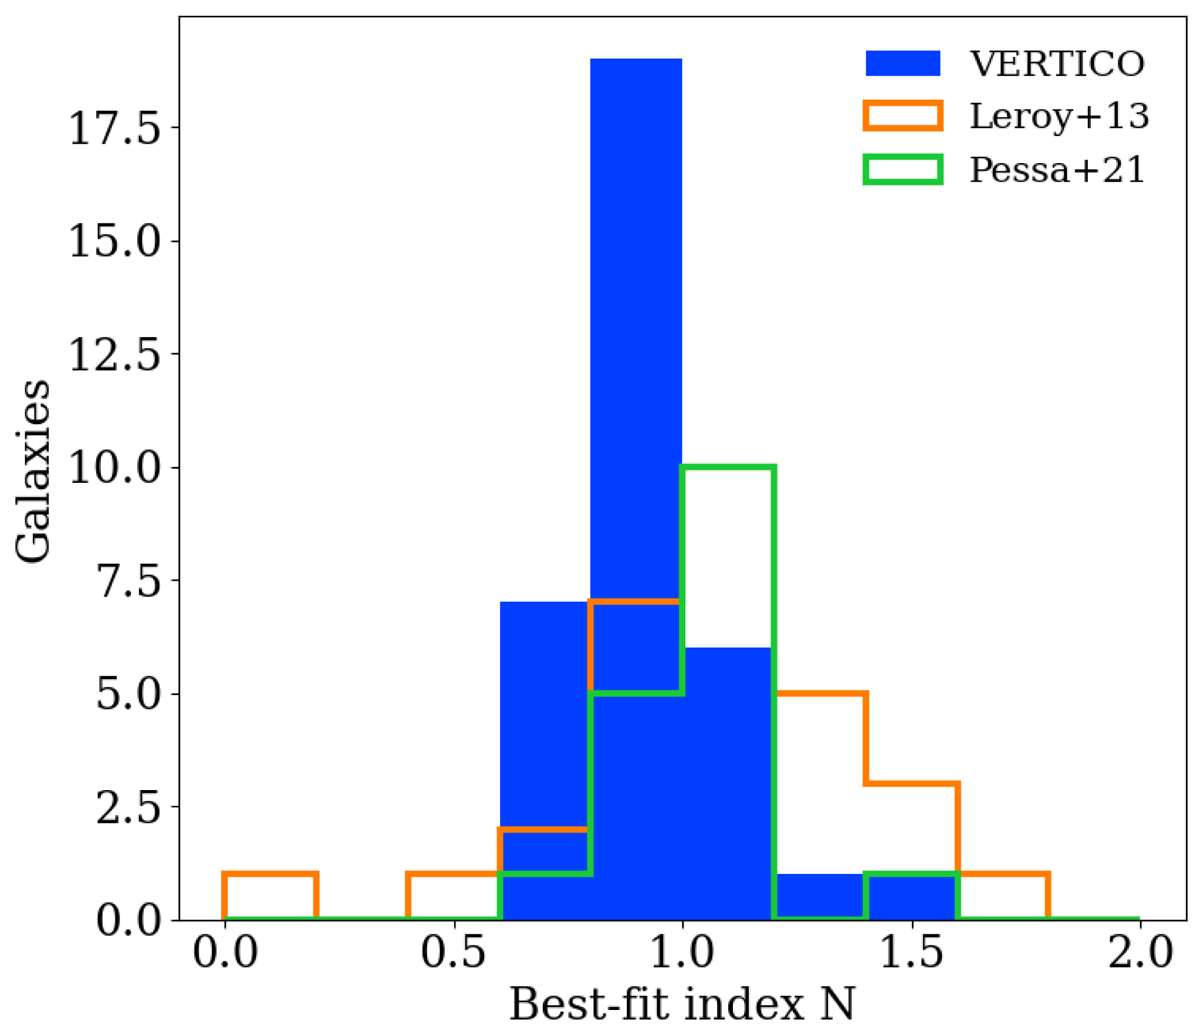
Histogram of best-fit power-law KS index, N, for individual galaxies in VERTICO (blue color, see Table A.1) using a fixed CO-to-H2 conversion factor. For a comparison, orange bars represent the sub-sample of HERACLES galaxies used in Leroy et al. (2013) and green bars show the best-fit slopes found for the sub-sample of PHANGS galaxies presented in Pessa et al. (2021). The distribution of best-fit N for individual galaxies in VERTICO spans the range N ∼ 0.7 − 1.5 and peaks near N = 0.9, while this value is slightly larger for the HERACLES and PHANGS distributions.
Current usage metrics show cumulative count of Article Views (full-text article views including HTML views, PDF and ePub downloads, according to the available data) and Abstracts Views on Vision4Press platform.
Data correspond to usage on the plateform after 2015. The current usage metrics is available 48-96 hours after online publication and is updated daily on week days.
Initial download of the metrics may take a while.