Fig. 5.
Download original image
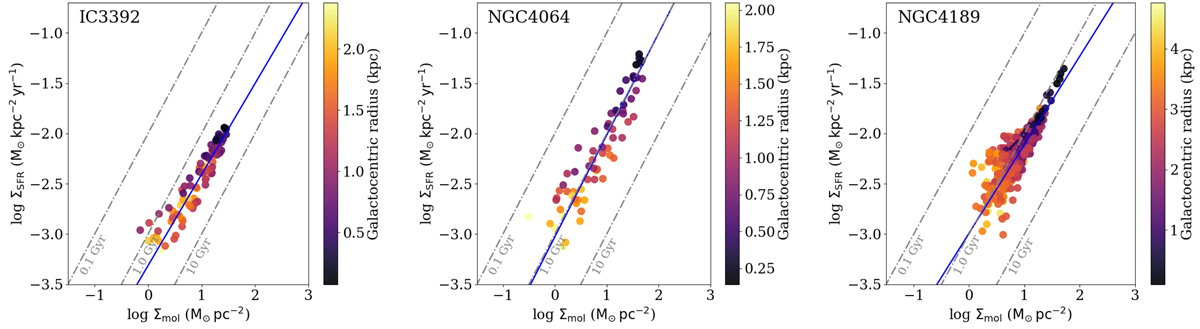
The resolved Kennicutt-Schmidt relation for the sub-sample of galaxies in the VERTICO sample with inclinations i ≤ 80°, represented as ΣSFR as a function of Σmol. All data points are convolved to a common working resolution of 720 pc. Each data point is color-coded by the distance to the galaxy center. The diagonal dashed, grey lines show constant depletion times of 0.1, 1 and 10 Gyr, respectively. For a fixed molecular gas mass, there are clear galaxy-to-galaxy variations in the KS relation. OLS weighted fits to the line-of-sight measurements are the solid blue lines shown in Table A.1. Note that values for ΣSFR and Σmol have been corrected via cos i. The rest of the panels can be found in Fig. A.1.
Current usage metrics show cumulative count of Article Views (full-text article views including HTML views, PDF and ePub downloads, according to the available data) and Abstracts Views on Vision4Press platform.
Data correspond to usage on the plateform after 2015. The current usage metrics is available 48-96 hours after online publication and is updated daily on week days.
Initial download of the metrics may take a while.