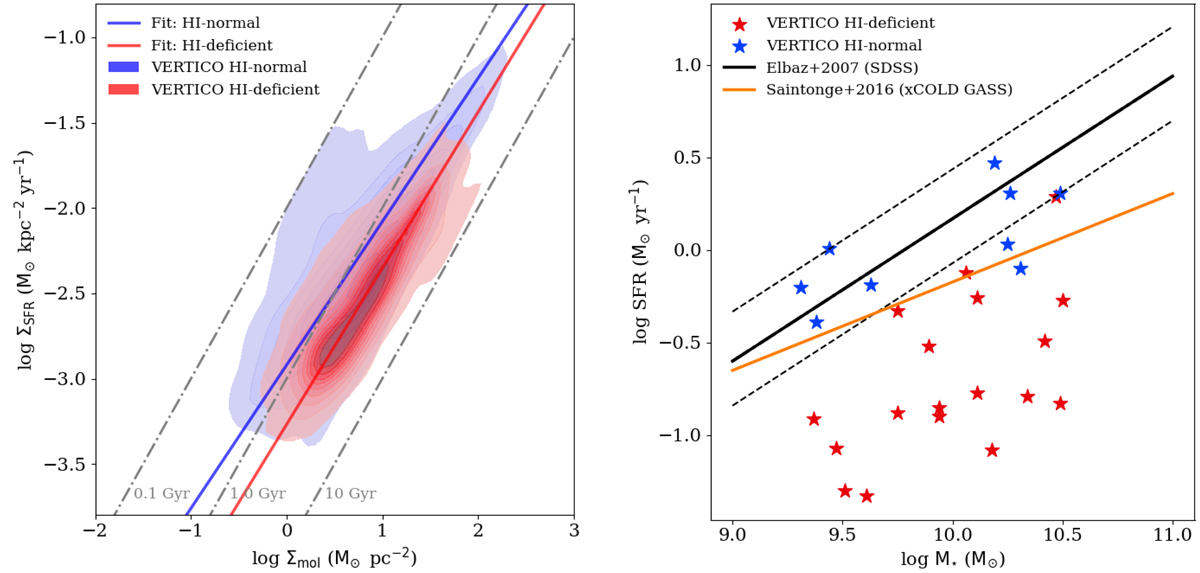
Fig. 3.
Download original image
Left: resolved KS relation for the VERTICO ensemble sample at a resolution of 720 pc. The red contours show the relation obtained for HI-deficient galaxies, according to Zabel et al. (2022), whereas the blue contours indicate the relation obtained for normal galaxies. Solid lines indicate LTS fits to the data. Similarly to Fig. 2 only galaxies with i < 80° have been considered and values for ΣSFR and Σmol have been corrected to face-on via cos i. The plot shows longer gas depletion times for HI-deficient VERTICO galaxies. Right: SFR − M⋆ relation for the VERTICO subsample, limited to HI-deficient and HI-normal galaxies covering the same range in stellar mass. The different colors indicate HI-deficient (red) and HI-normal (blue) galaxies. Overlaid are the star formation main sequence (SFMS) relation obtained in Elbaz et al. (2007) in black (solid line), as well as that presented in xCOLD GASS in orange (Saintonge et al. 2016). While VERTICO HI-normal galaxies lie on the SFMS, HI-deficient galaxies are mostly scattered below the SFMS.
Current usage metrics show cumulative count of Article Views (full-text article views including HTML views, PDF and ePub downloads, according to the available data) and Abstracts Views on Vision4Press platform.
Data correspond to usage on the plateform after 2015. The current usage metrics is available 48-96 hours after online publication and is updated daily on week days.
Initial download of the metrics may take a while.