Fig. 7.
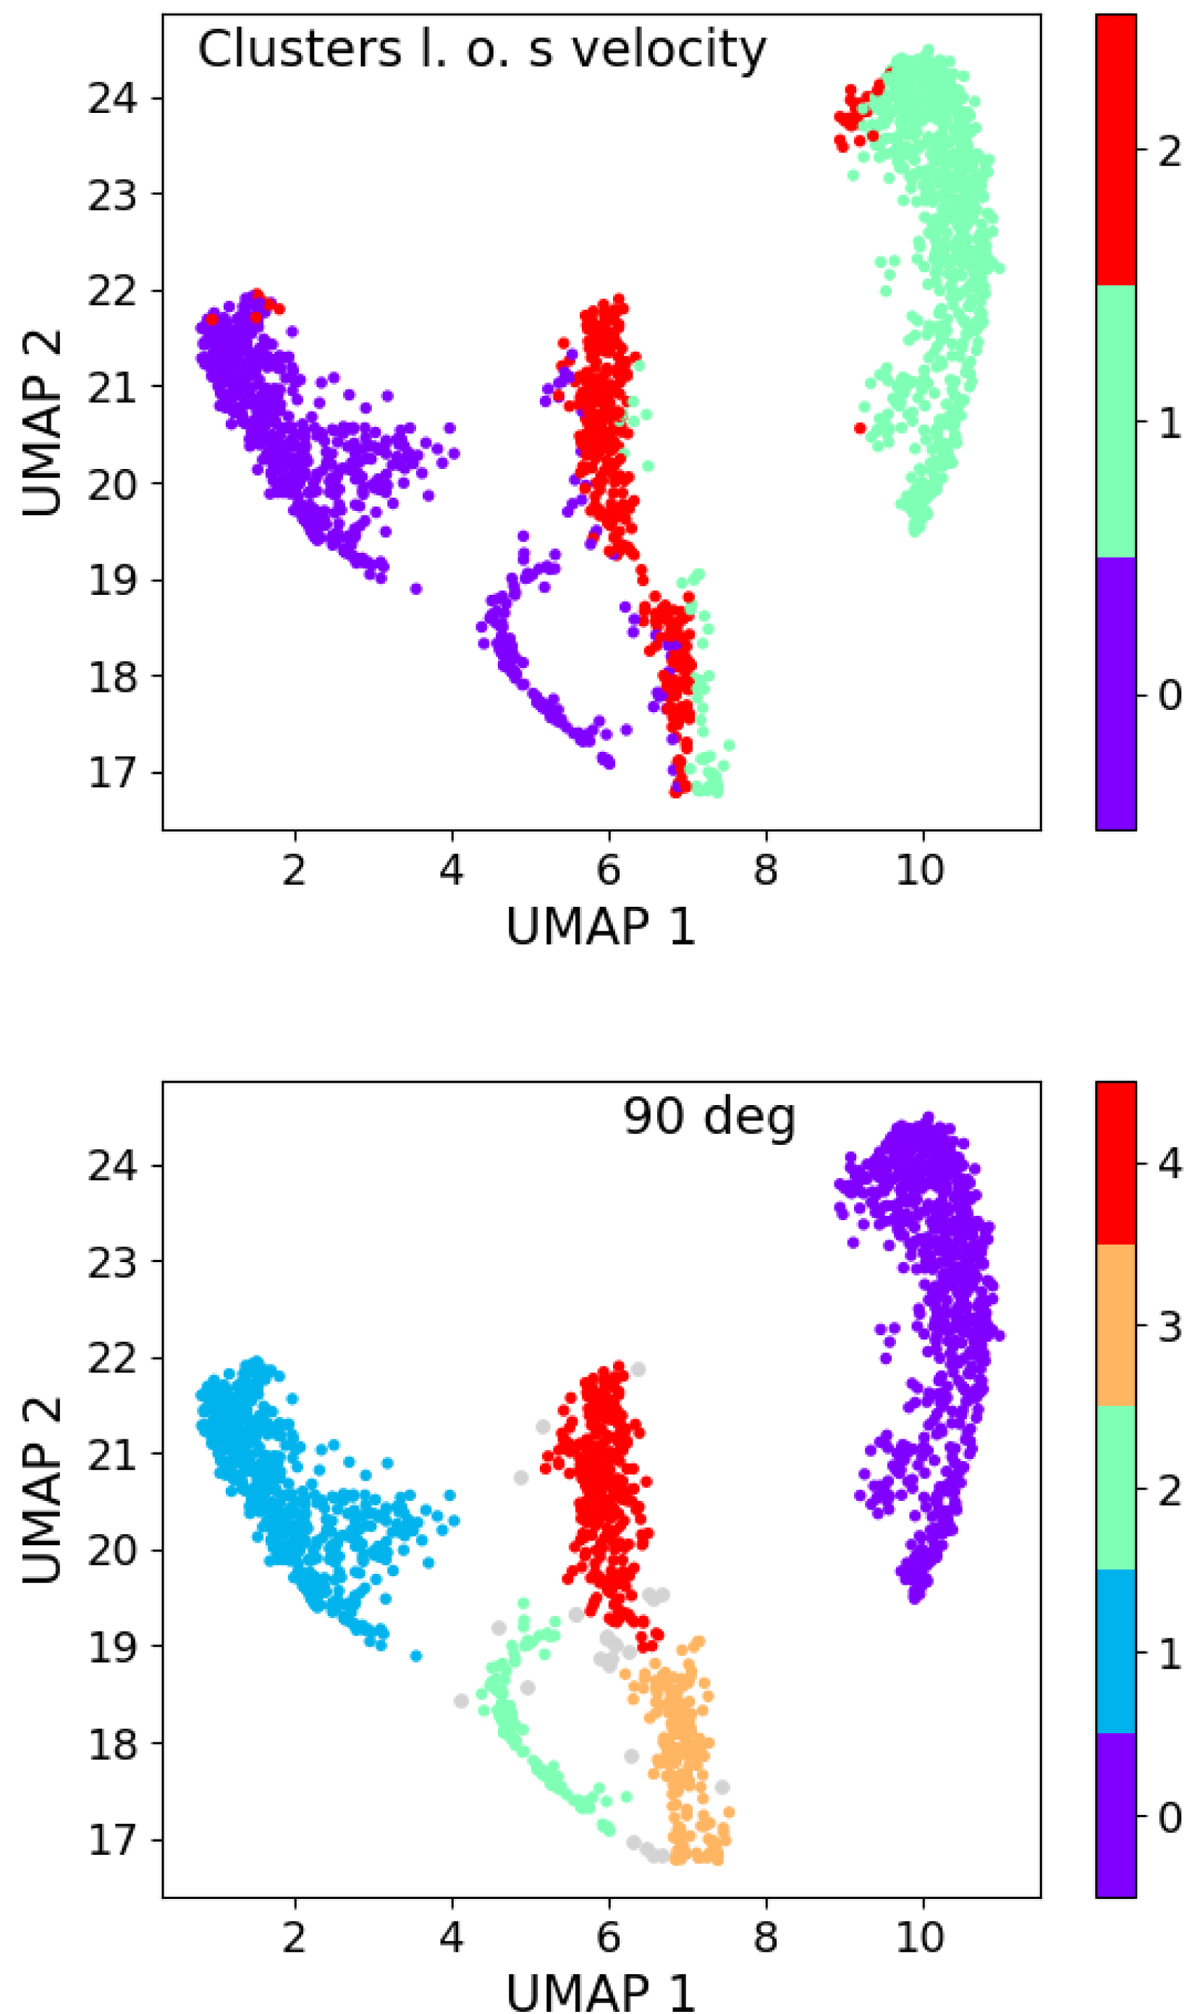
Download original image
Comparison between the clustering obtained using all kinematic map types and the line-of-sight velocity maps alone discussed in Sect. 4.1. Top panel: UMAP projection obtained from all kinematic maps according to the clustering obtained for the line-of-sight velocity maps, colour-coded as in Fig. 2. Bottom panel: Clustering in Fig. 6, repeated here for comparison.
Current usage metrics show cumulative count of Article Views (full-text article views including HTML views, PDF and ePub downloads, according to the available data) and Abstracts Views on Vision4Press platform.
Data correspond to usage on the plateform after 2015. The current usage metrics is available 48-96 hours after online publication and is updated daily on week days.
Initial download of the metrics may take a while.