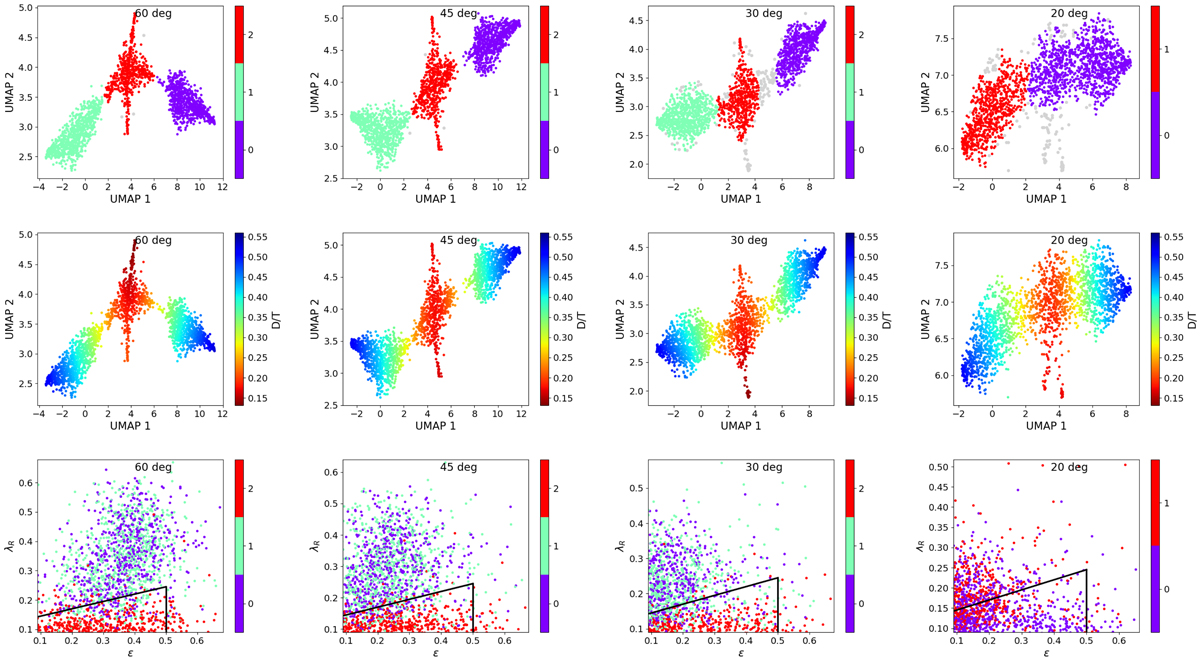
Fig. 5.
Download original image
Results of UMSCANGALACTIK applied to the line-of-sight velocity maps of our galaxy sample at different inclinations. Top panels: HDBSCAN clusters in the UMAP bidimensional projection of the line-of-sight velocity maps of galaxies observed at 60, 45, 30, and 20 degrees. The outliers of the method are shown as grey dots. Middle panels: Distributions of D/T on each projection. The colour bar limits are fixed to the 10th and 90th percentiles of the variables. Bottom panels: λR − ε plane. The symbols depict clusters following the same colour-coding as in the top panels. We include the criterion in Eq. (1) depicted by the black solid lines.
Current usage metrics show cumulative count of Article Views (full-text article views including HTML views, PDF and ePub downloads, according to the available data) and Abstracts Views on Vision4Press platform.
Data correspond to usage on the plateform after 2015. The current usage metrics is available 48-96 hours after online publication and is updated daily on week days.
Initial download of the metrics may take a while.