Fig. 4.
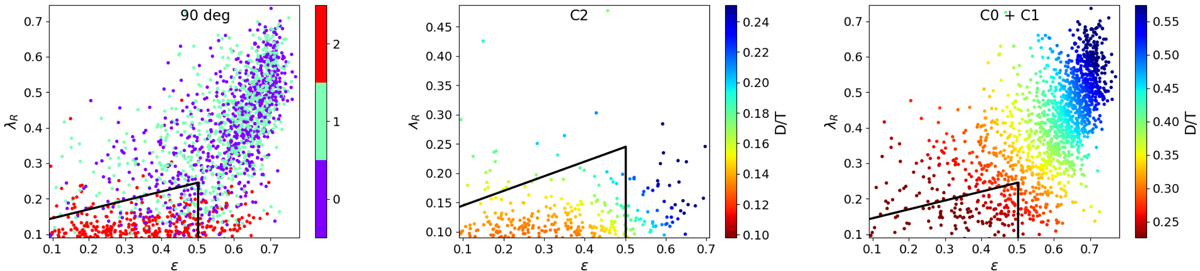
Download original image
Analysis of the λR − ε plane. Left panel: λR − ε plane for the clustered galaxies. The symbols depicting clusters follow the colour-coding in Fig. 2. Middle panel: λR − ε plane for galaxies of C2 colour-coded by D/T. Right panel: λR − ε plane for galaxies of C0 and C1 colour-coded by D/T. The colour bar limits are fixed to the 10th and 90th percentiles of the variables. We include in all cases the criterion in Eq. (1) depicted by the black solid lines.
Current usage metrics show cumulative count of Article Views (full-text article views including HTML views, PDF and ePub downloads, according to the available data) and Abstracts Views on Vision4Press platform.
Data correspond to usage on the plateform after 2015. The current usage metrics is available 48-96 hours after online publication and is updated daily on week days.
Initial download of the metrics may take a while.